


Hello everyone. In today’s article, we will look at the past performance of the 1 Hour Elliott Wave chart of Tesla Inc. ($TSLA) The rally from 6.06.2023 low unfolded as a 5 wave impulse with an incomplete bullish sequence from 5.31.2023 low. So, we advised members to buy the pullback in 3 swings at the blue box area ($251.83 – 245.83). We will explain the structure & forecast below:
$TSLA 1H Elliott Wave Chart 6.14.2023:
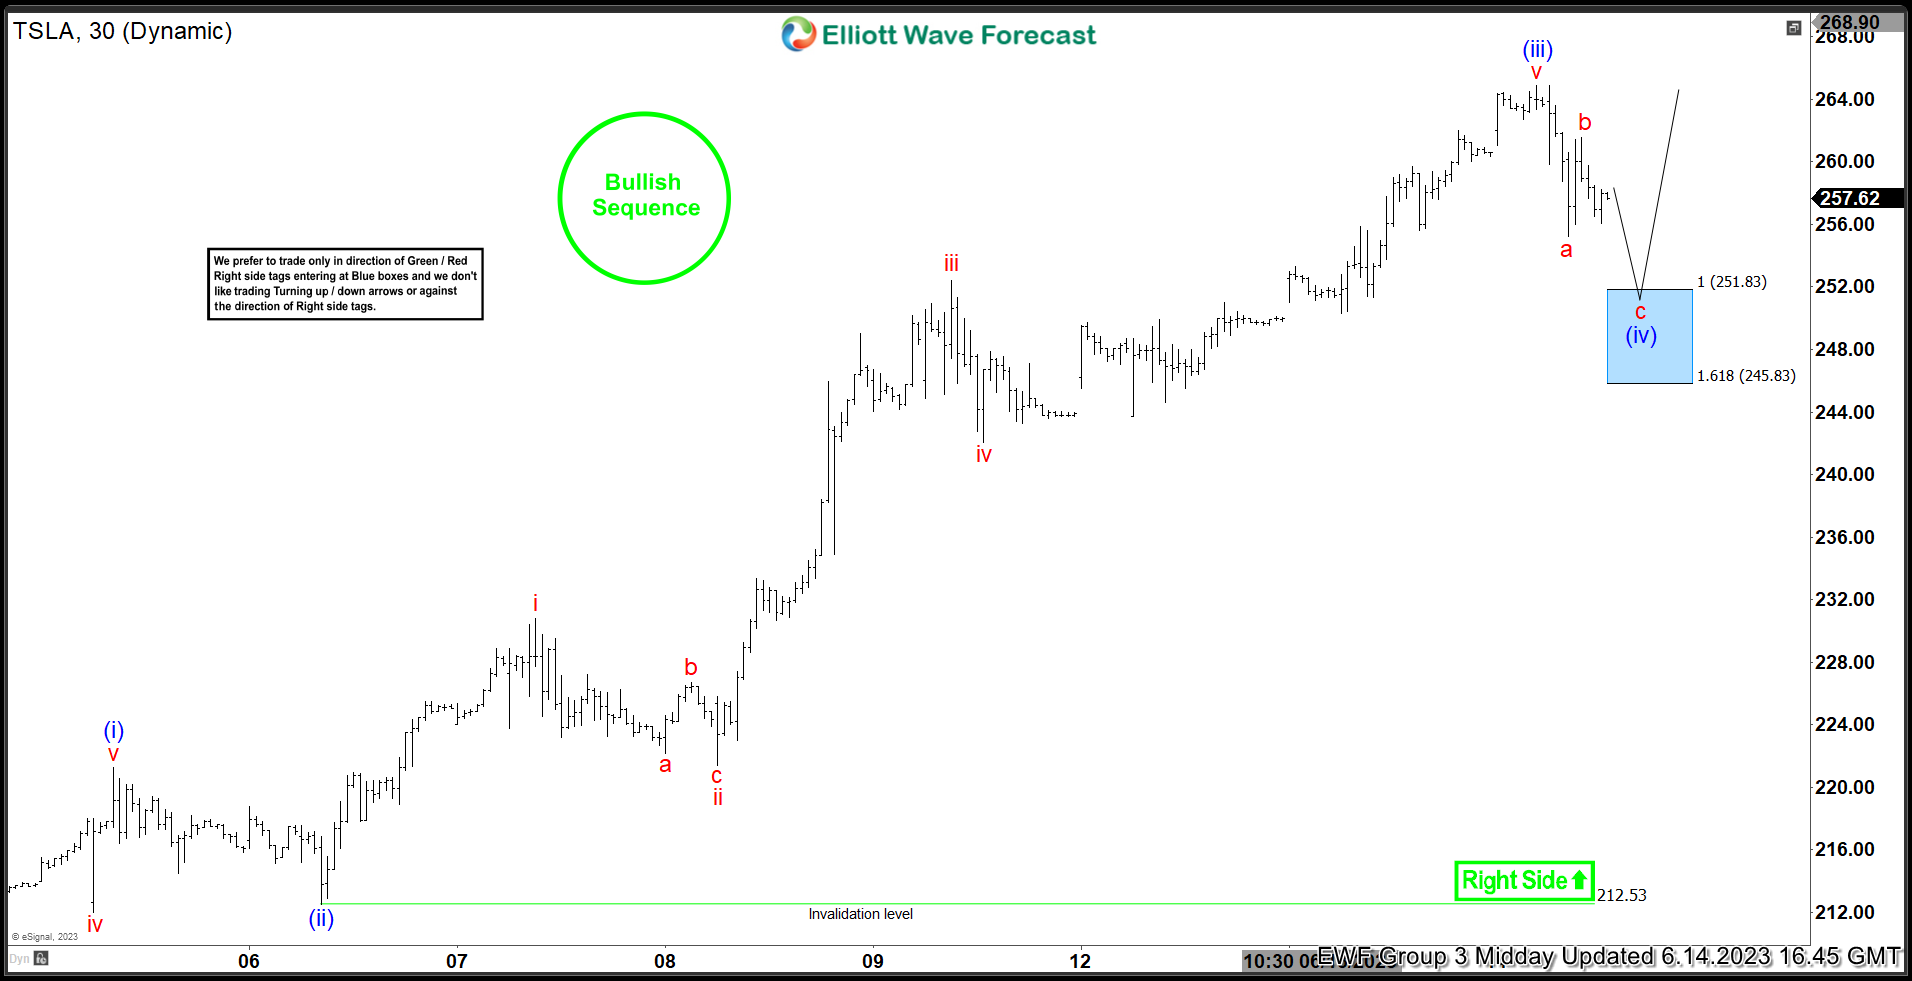
Here is the 1H Elliott Wave count from 6.14.2023. The rally from 6.06.2023 at (ii) unfolded in a 5 wave impulse which signaled a bullish trend. We expected the pullback to find buyers in 3 swings at $251.83 – 245.83 where we entered as buyers.
$TSLA 1H Elliott Wave Chart 6.15.2023:
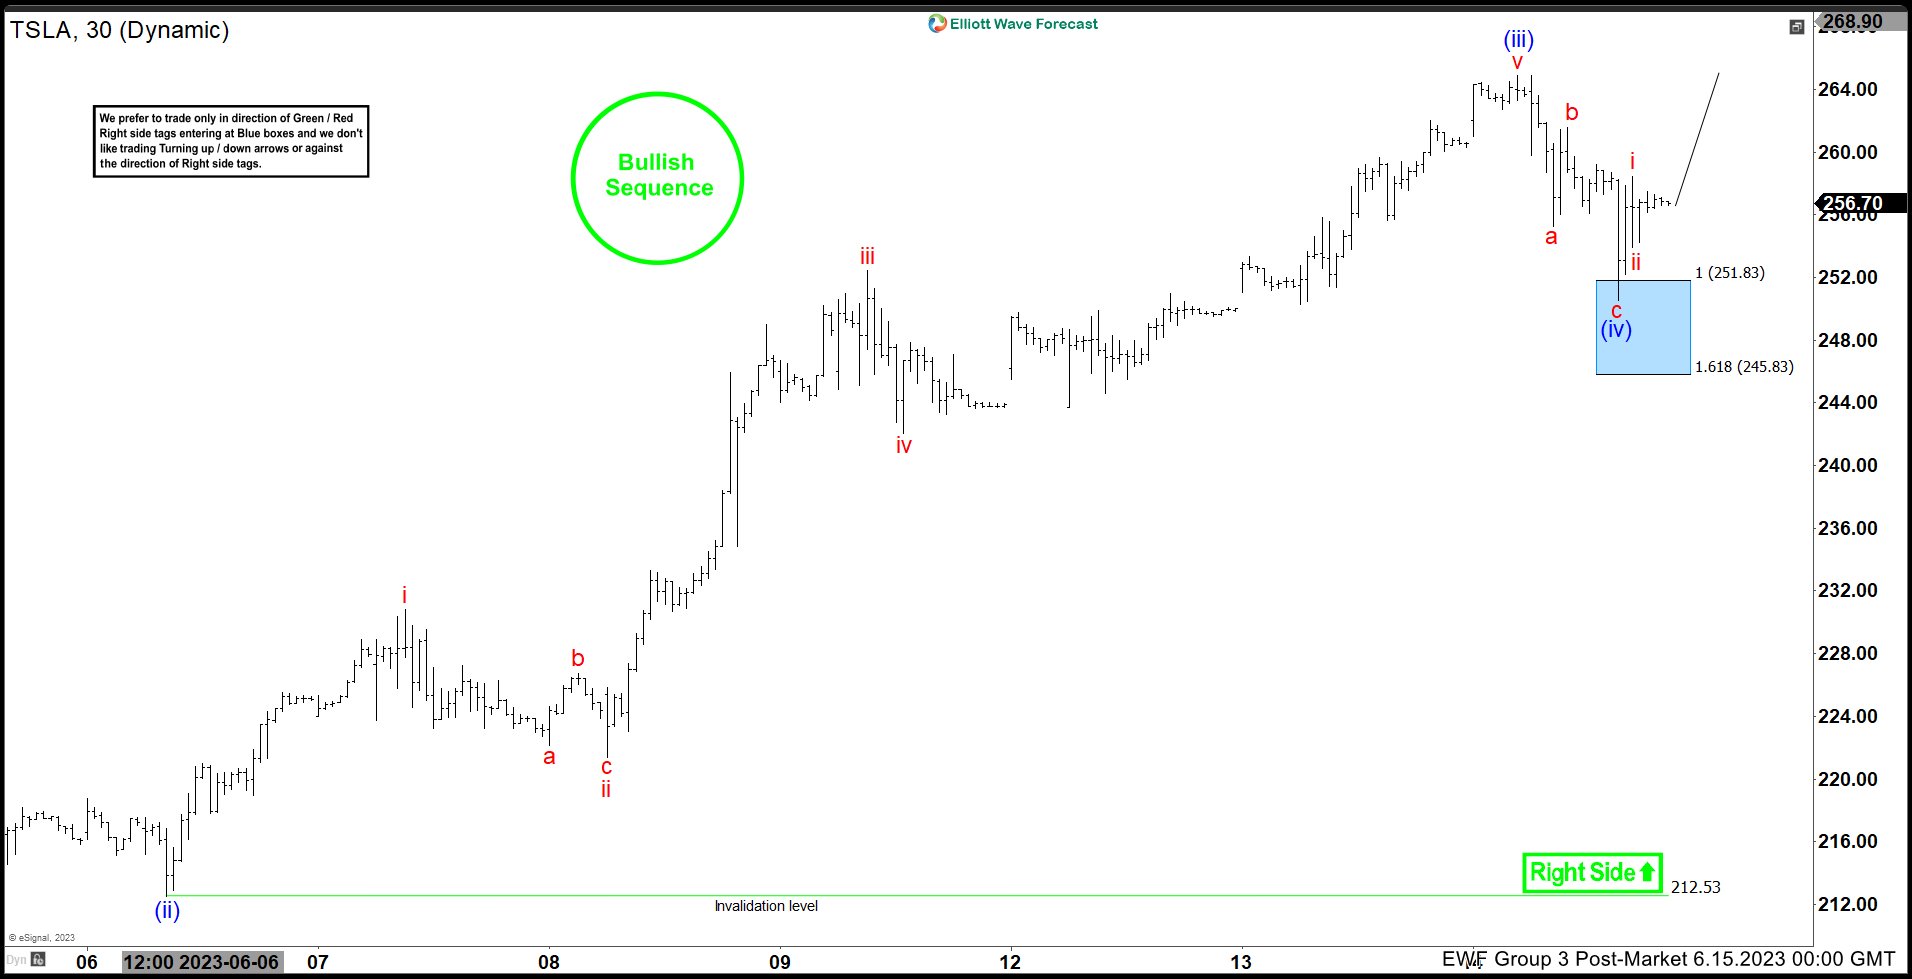
Here is the next day 1H update showing the move taking place as expected. The stock has reacted higher ending the cycle from 6.14.2023 peak allowing longs to get a risk free position. We expect more upside towards $270 - 350 area in the near term.
Source: https://elliottwave-forecast.com/stock-market/tesla-inc-tsla-reacts-higher-blue-box-area/
