


CVS Health Corporation is an US American healthcare company. Founded in 1963 and headquartered in Woonsocket, Rhode Island, USA, it is a part of S&P100 and S&P500 indices. Investors can trade it under the ticker $CVS at New York Stock Exchange. CVS Health owns CVS Pharmacy, a retail pharmacy chain; CVS Caremark, a pharmacy benefits manager; and Aetna, a health insurance provider, among many other brands..
CVS Health Monthly Elliott Wave Analysis 07.29.2023
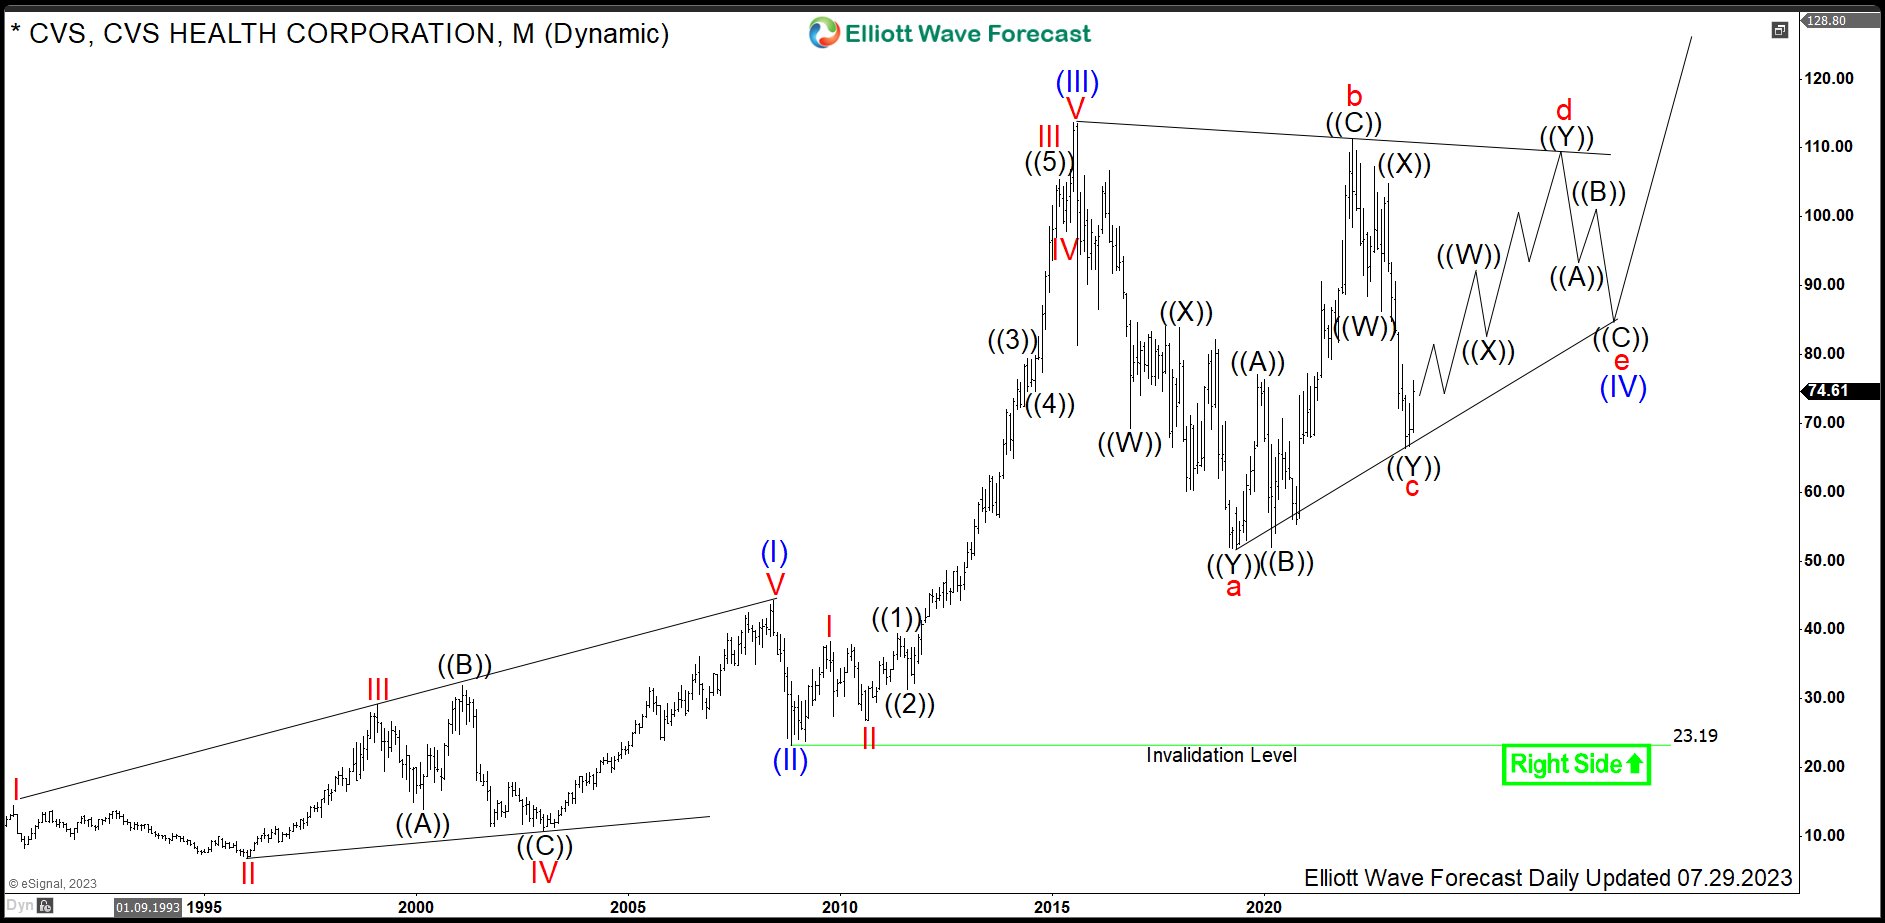
The monthly chart below shows the CVS Health stock $CVS traded at NYSE. From the all-time lows, the stock price is developing an impulse structure. Firstly, leading diagonal in blue wave (I) of super cycle degree has ended in June 2008 at 44.29 highs. From there, a pullback in blue wave (II) has set a bottom in December 2008 at 23.19 lows. Then, from the December 2008 lows, new cycle has started. It has printed the all-time highs in June 2015 at $113.65. Importantly, that cycle has extended beyond 2.0 multiples of the wave (I). As a matter of fact, one should count it as an extended blue wave (III) of super cycle degree. Therefore, natural Elliott wave count would suggest blue waves (IV) and (V) still to follow. These two waves should accomplish the impulse from all-time lows in black wave ((I)) of grand super cycle degree.
It is the preferred view that wave (IV) is currently in progress. Indeed, while below the all-time highs, wave (V) has not been confirmed yet. The wave pattern shows a converging price action. It is the preffered view that we are dealing with an Elliott wave contracting triangle being 3-3-3-3-3 structure. Within it, waves a-b-c have ended. While above 66.34 lows, red wave d should extend higher in 3 or 7 swings. After a pullback in red wave e, expect a thrust higher in blue wave (V). The target for blue wave (V) is 128.66-152.41 area and possibly higher.
CVS Health Daily Elliott Wave Analysis 07.29.2023
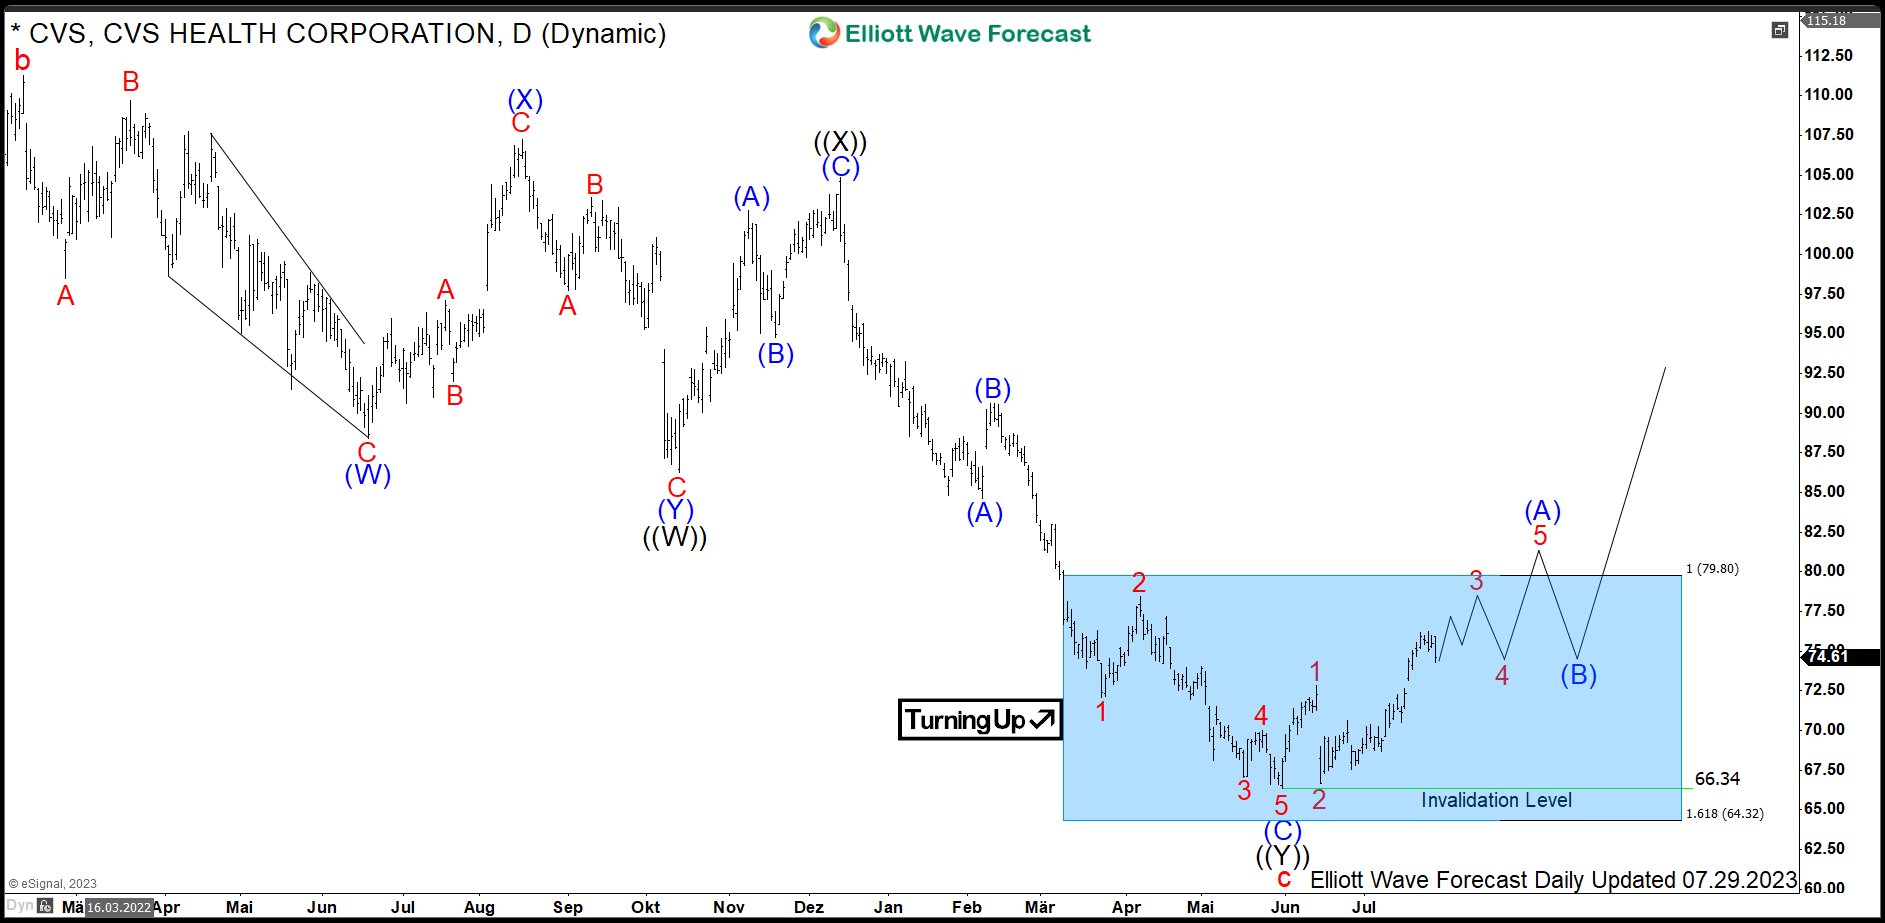
The daily chart below shows the 3rd swing out of 5 within bullish triangle in blue wave (IV). Following first two swings being red waves a and b, 3rd swing in red wave c has started from 111.25 highs back in February 2022. It has unfolded as a double three pattern being 3-3-3 structure.
Firsty, 3 swings in black wave ((W)) of red wave c have printed a low at $86.28 in October 2022. Then, a bounce has set a connector wave ((X)) at $104.83 highs in December 2022. Later on, the price has broken 86.28 lows opening up a bearish sequence. As a consequence, target area for black wave ((Y)) is towards 79.80-64.32 area. It has been reached within another 3 swings of the wave ((Y)). It is the preffered view, that wave c has ended in May 2023 at 66.34 lows. While above there, new cycle in red wave d has started.
Investors and traders can be looking to buy $CVS from 79.80-64.32 area targeting 128.66-152.41 and even higher in the long run.
Source: https://elliottwave-forecast.com/stock-market/cvs-health-bullish-triangle/
