Elliottwave Forecast Blog | SPX Elliott Wave View: Pull Back Started | TalkMarkets
ElliotWave Forecast
Contributor's Links: Elliottwave Forecast
At Elliottwave-Forecast, we offer 24 hour coverage of 52 instruments from Monday – Friday using Elliott Wave Theory as primary tools of analysis. We provide Elliott Wave chart in 4 different time frames, up to 4 times a day update in 1 hour chart, two live sessions by our expert analysts, 24 ...more

SPX Elliott Wave View: Pull Back Started

Date: Friday, May 12, 2017 5:44 AM EDT

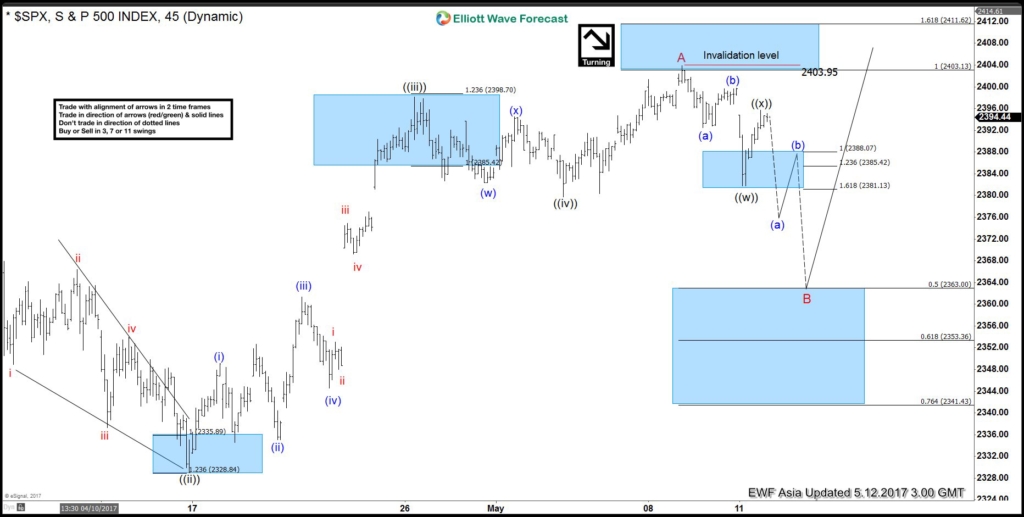
Short Term Elliott Wave view in SPX suggests that the rally from 3/27 low (2322.2) ended at 2403 as a leading diagonal Elliott Wave structure where Minute wave ((i)) ended at 2378.3, Minute wave ((ii)) ended at 2328.95, Minute wave ((iii)) ended at 2398.16, Minute wave ((iv)) ended at 2379.75, and Minute wave ((v)) of A ended at 2403.

Near-term, while bounces remain below there expect the  Index to pull back in larger degree 3, 7, or 11 swings to correct cycle from 3/27 low before the rally resumes again. We don’t like selling the Index and expect buyers to appear after 7 or 11 swings pull back for extension higher. This view remains valid as far as pivot at 3/27 (2322.2) low remains intact.

SPX 1 Hour Elliott Wave Chart 05/12/2017

(Click on image to enlarge)

Disclaimer: This and other personal blog posts are not reviewed, monitored or endorsed by TalkMarkets. The content is solely the view of the author and TalkMarkets is not responsible for the content of this post in any way. Our curated content which is handpicked by our editorial team may be viewed here.

Comments

Leave a comment to automatically be entered into our contest to win a free Echo Show.