


Great Year for Precious Metals
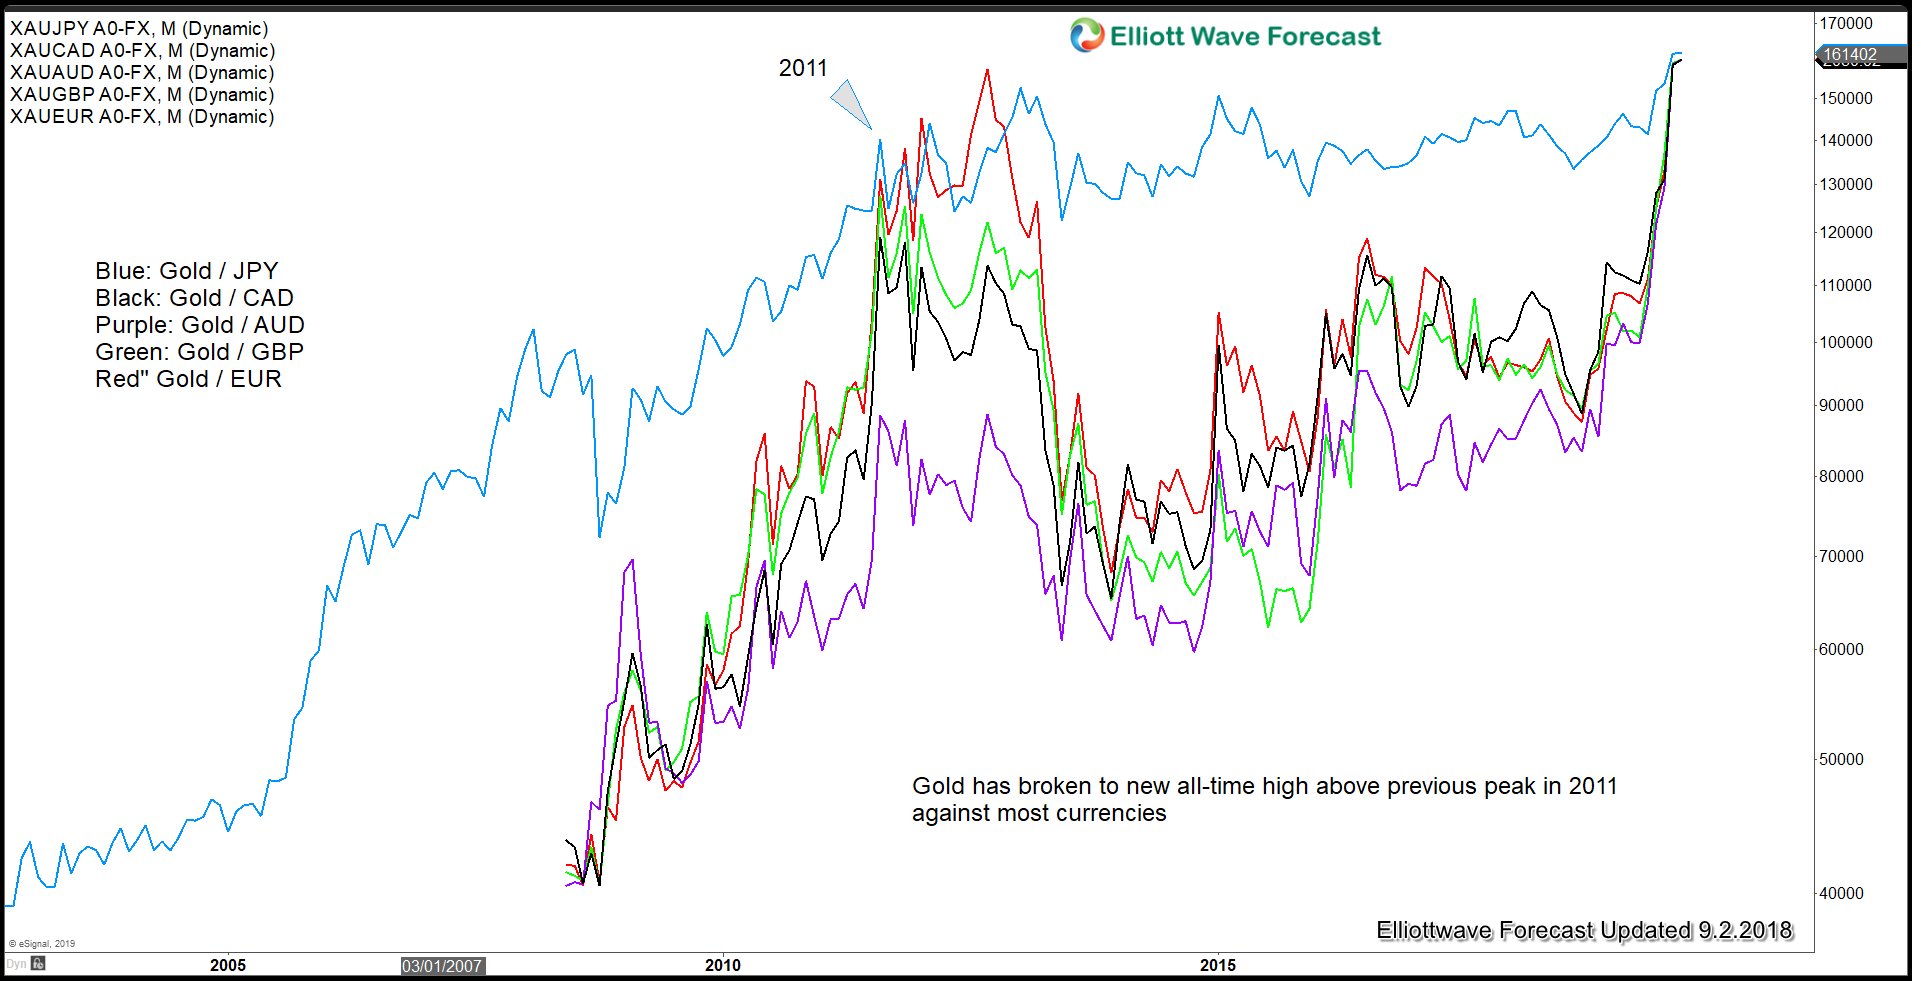
Year 2019 certainly has been a good year for the Gold bulls. The metal accelerated its rally after President Trump announced 10% tariffs on the remaining $300 billion of Chinese imports. China then let the Yuan weaken and rise above 7 against the U.S. dollar for the first time in more than a decade. Currently, Gold's price is either near or at all-time high in most currencies except the U.S. dollar. Below, we can see the chart of Gold breaking to new all-time high against major currencies.
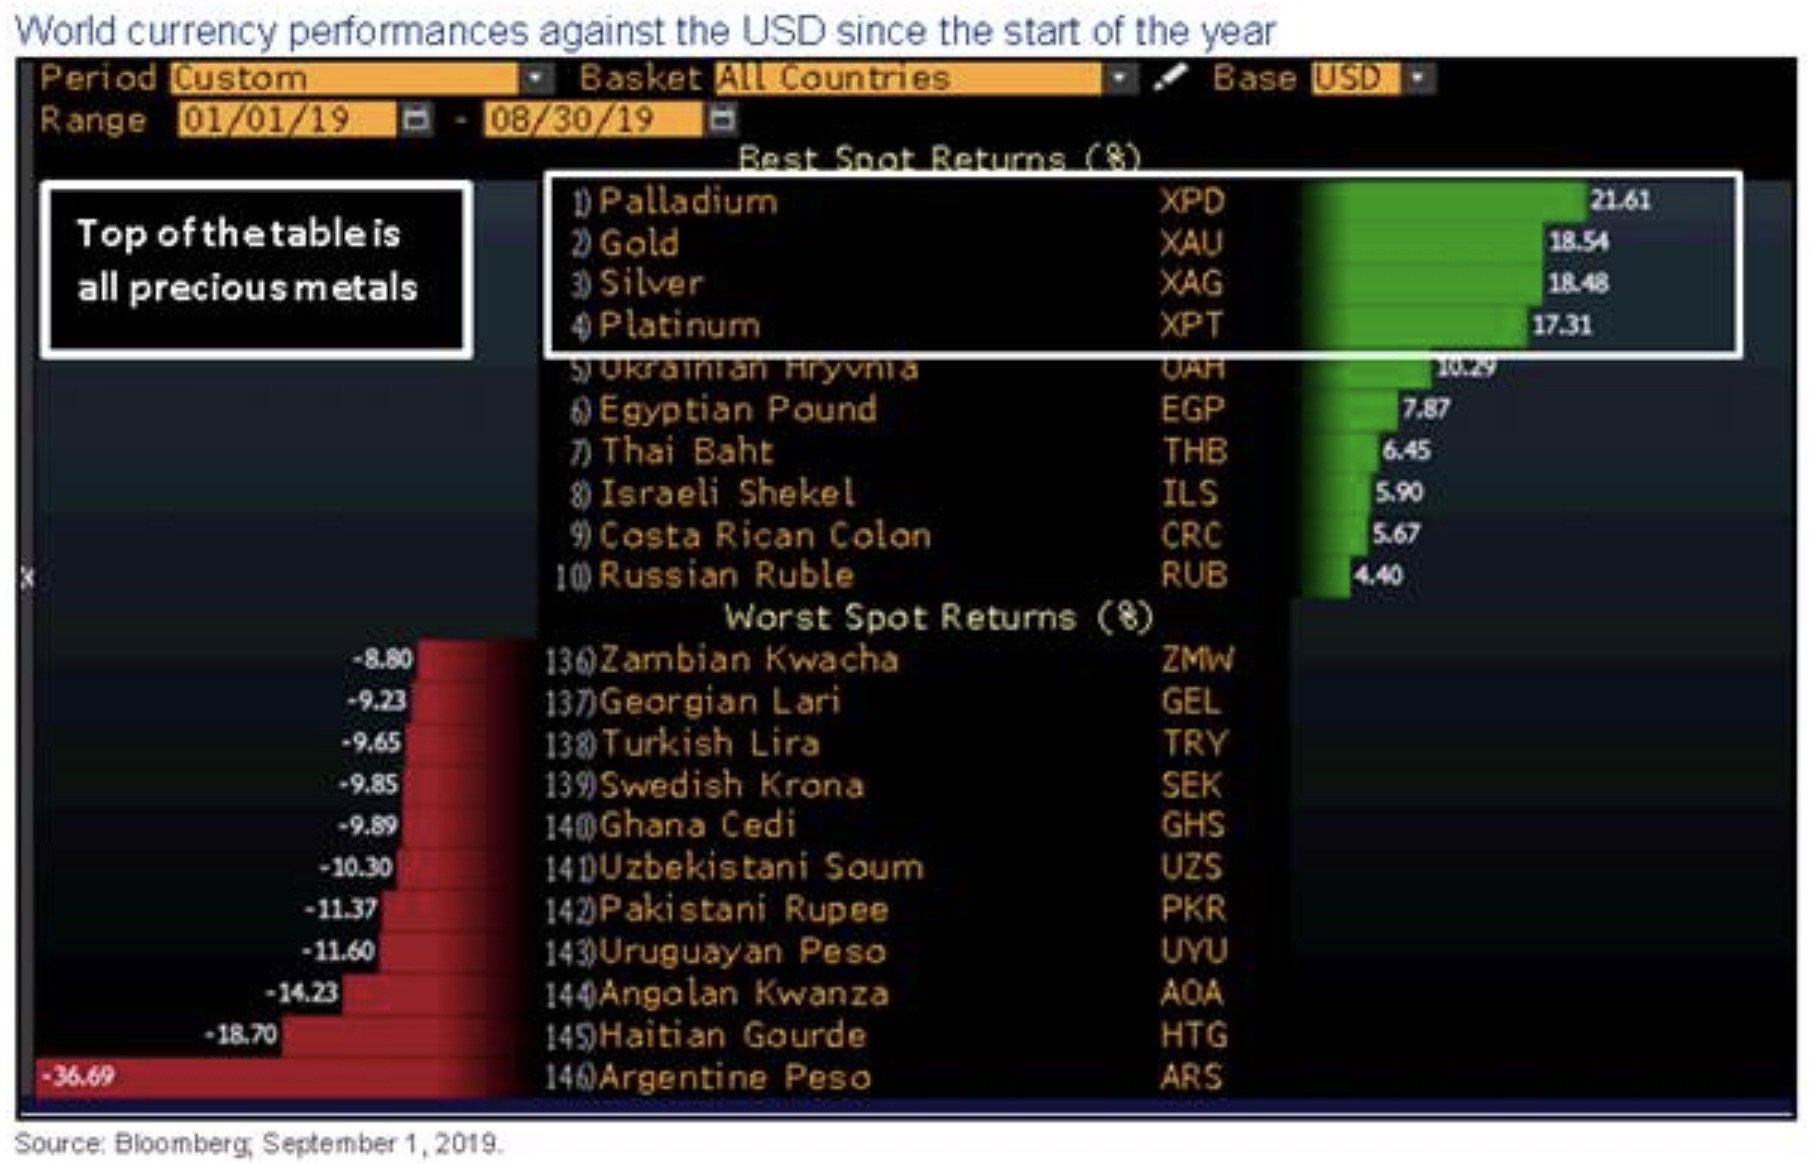
The chart below from Bloomberg shows the performance of world currencies against the U.S dollar. Precious metals get included as they do have the function similar to currencies. Central banks around the world also have them as a reserve. As the chart below shows, the top 4 best performing currencies against U.S dollar is all precious metals.
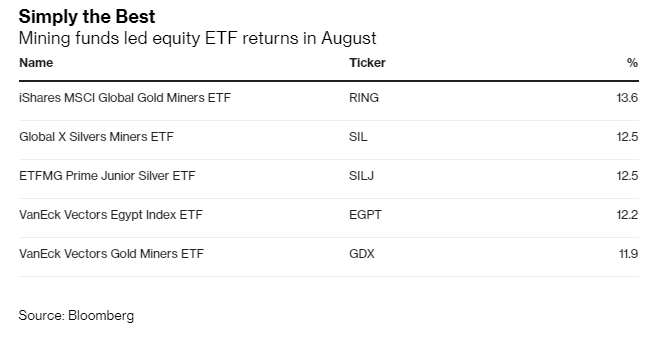
The top performing ETF in August is also related to the precious metals as the chart below shows. With bond yields going negative, many investors who want to reduce risk go to alternative instrument including commodities.
Gold to Silver Ratio Breaking Down
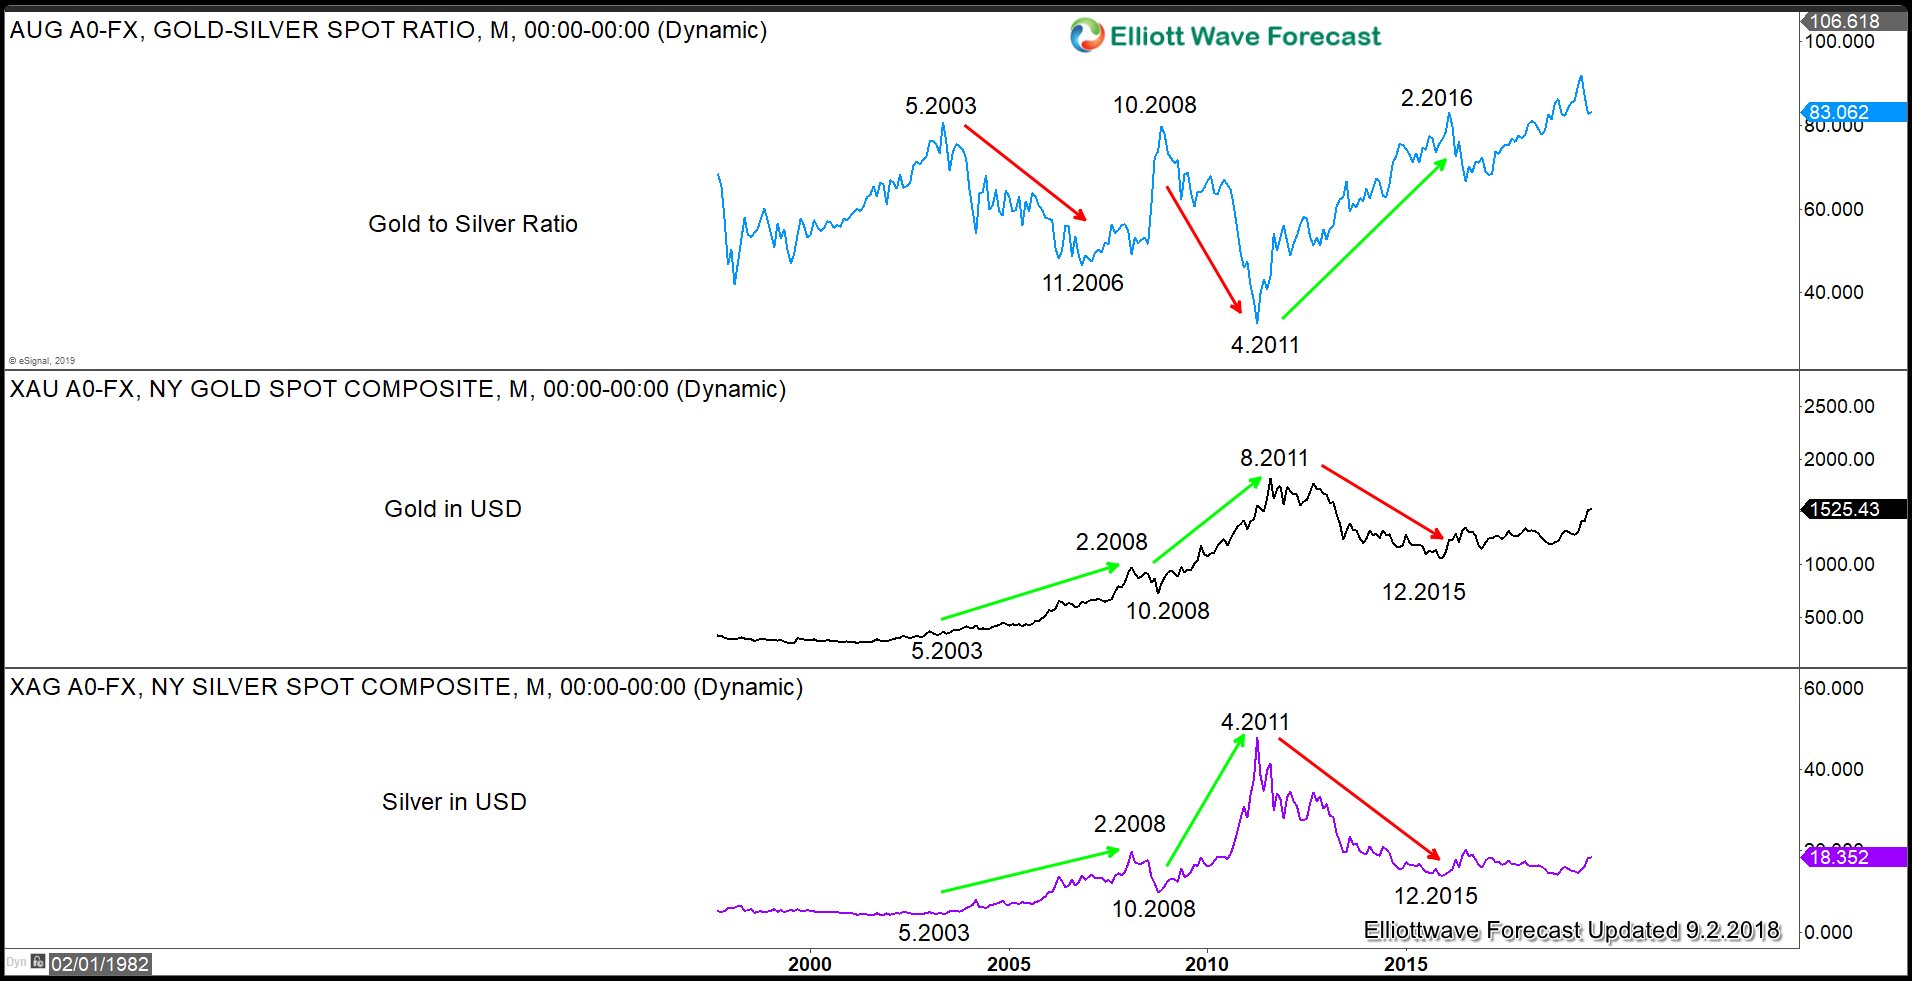
Overlay of Gold-to-Silver ratio chart together with Gold and chart above show an inverse correlation. We can see a period from 10.2008 to 4.2011 where the ratio went lower while the price of both precious metals rallied. We can also see a period from 4.2011 to end of 2015 when the ratio rose and the price of Gold and Silver both went lower. The ratio has recently started to turn lower again after forming a multi year high around mid 90s. The average of this ratio in the past 3 decades is around 60, and the natural earth ratio is currently 9. It means that for every 1 ounce of Gold mined from the earth, we can find 9 ounce of silver.
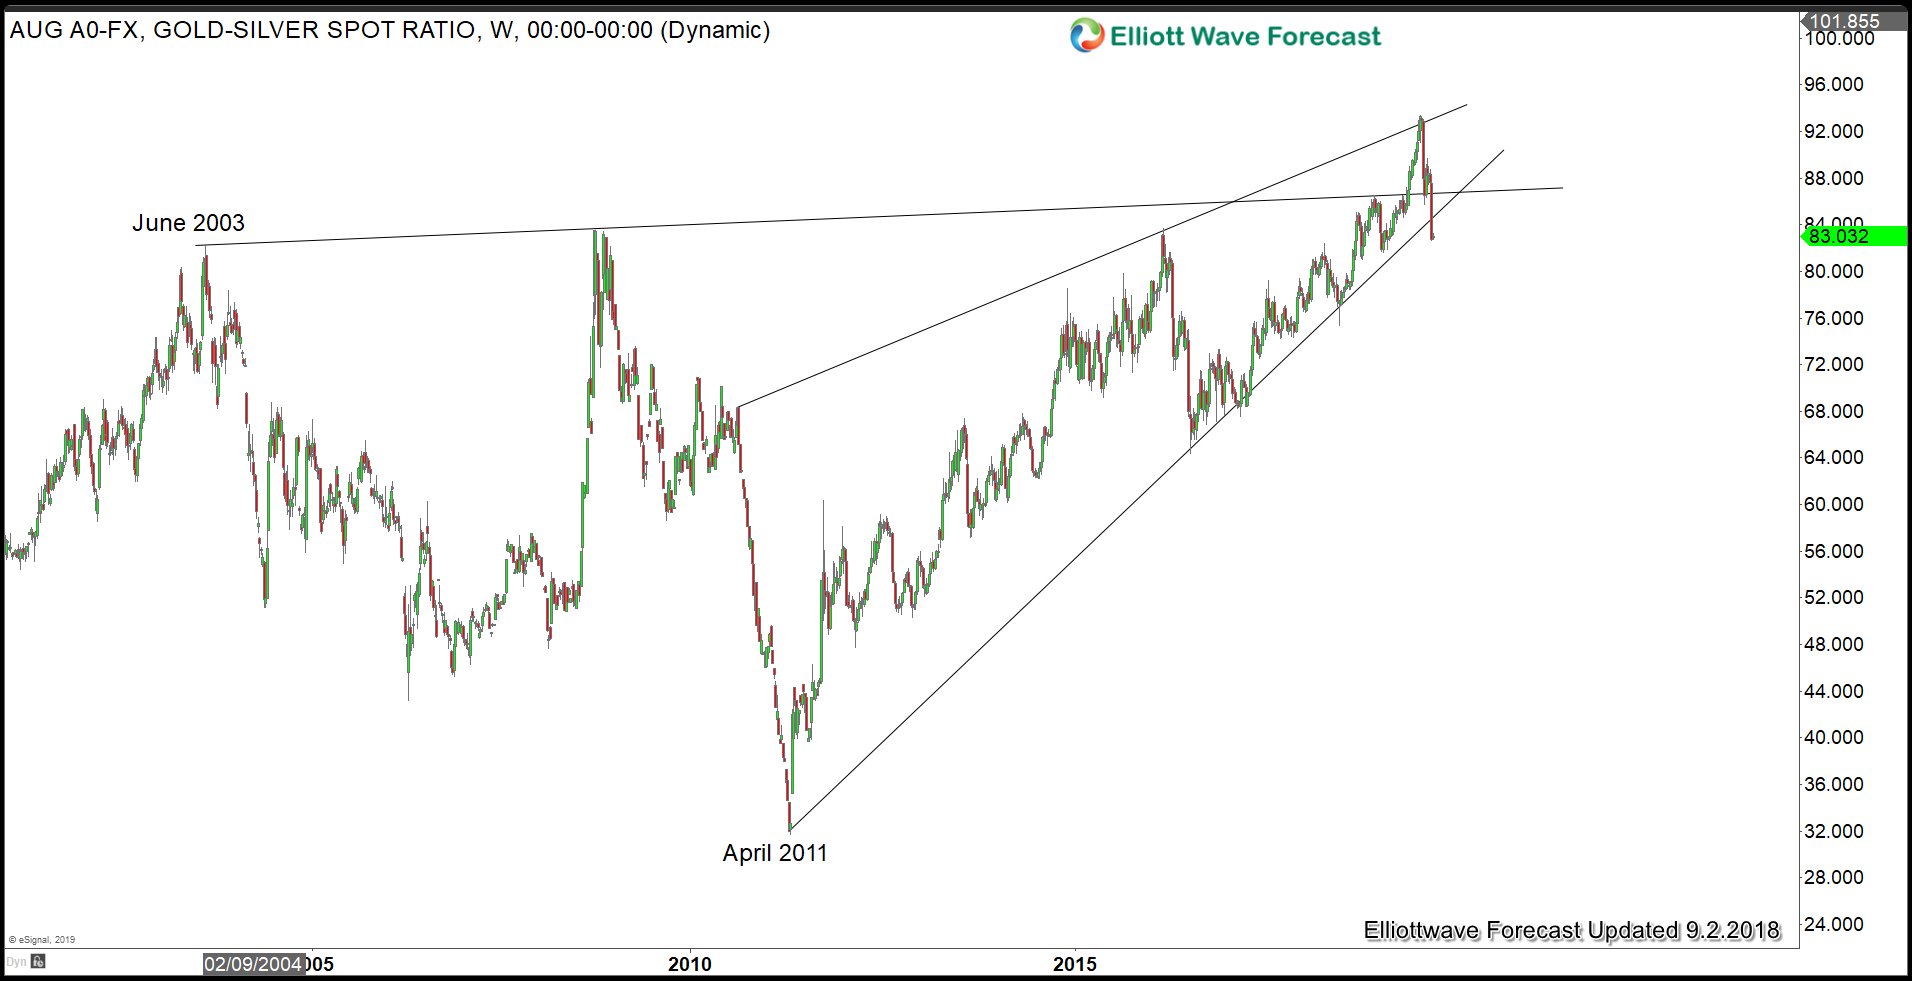
The ratio just last week decisively broke down and closed below the ascending trend line from April 2011. This suggests that more downside should be expected in coming months / years. With the ratio breaking down, and Gold breaking to new all time high against most world currencies, expect the precious metals to be the start performer in the months and years ahead.
