


Hello fellow traders. In this technical article we’re going to take a look at the Elliott Wave charts charts of Dollar index published in members area of the website. As our members know USDX has recently made recovery against the 105.87 peak that has unfolded as Elliott Wave Double Three Pattern. It made clear 7 swings from the lows and completed correction near the extreme zone. In further text we’re going to explain the Elliott Wave pattern and forecast
Before we take a look at the real market example, let’s explain Elliott Wave Double Three pattern.
Elliott Wave Double Three Pattern
Double three is the common pattern in the market , also known as 7 swing structure. It’s a reliable pattern which is giving us good trading entries with clearly defined invalidation levels.
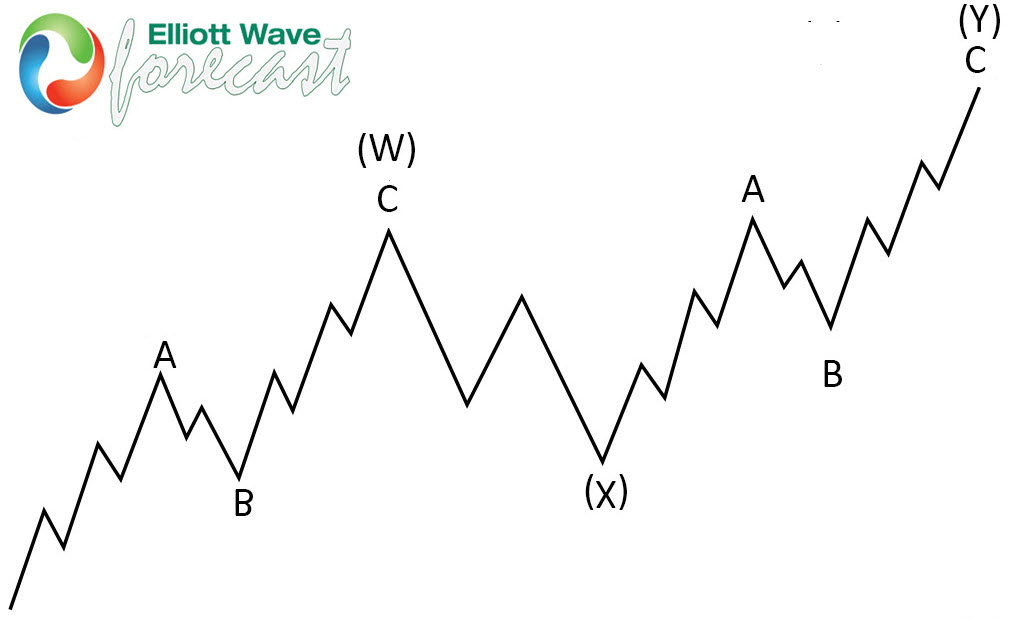
The picture below presents what Elliott Wave Double Three pattern looks like. It has (W),(X),(Y) labeling and 3,3,3 inner structure, which means all of these 3 legs are corrective sequences. Each (W) and (Y) are made of 3 swings , they’re having A,B,C structure in lower degree, or alternatively they can have W,X,Y labeling.
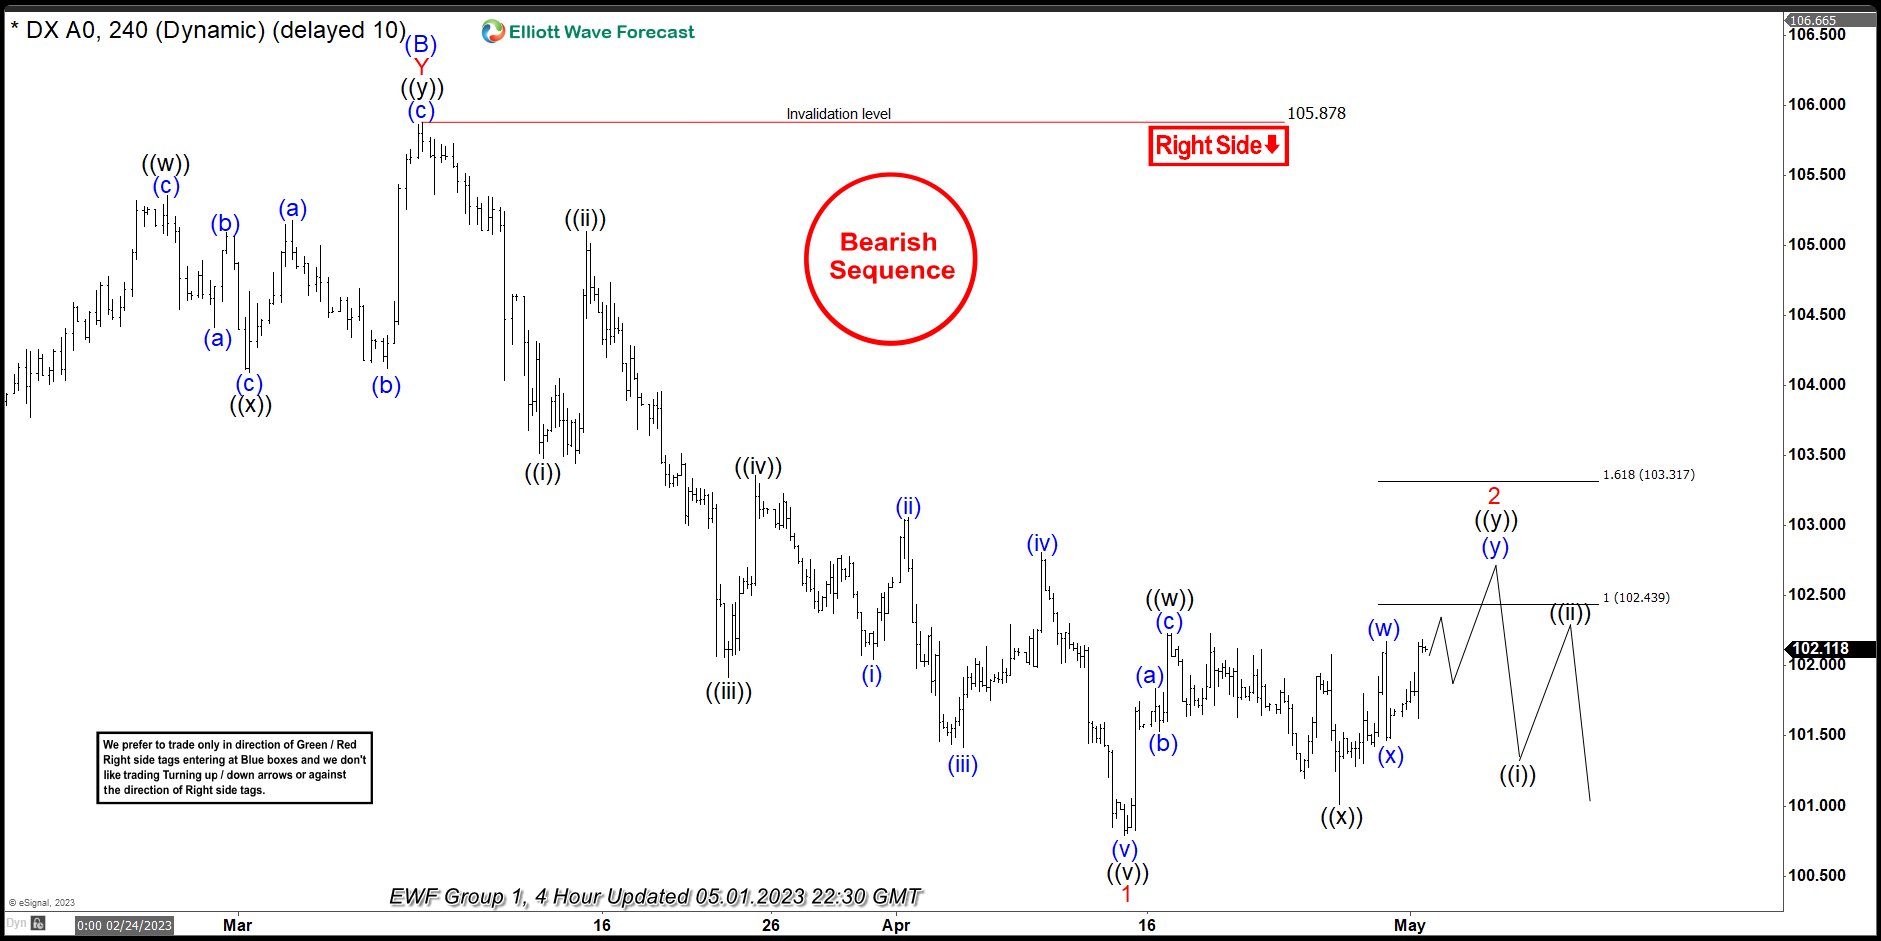
USDX 1h Hour Elliott Wave Analysis 05.01.2023
Dollar index ended cycle from the 105.87 peak as 5 waves structure. Currently USDX is giving us 2 red recovery that is unfolding as Elliott Wave Double Three Pattern. Correction has ((w))((x))((y)) black inner labeling. The price structure is still incomplete. We expect to see more short term strength in 7th swing toward 102.43-103.3 area to complete proposed correction. At that zone buyers should be ideally taking profits and sellers can appear again. Consequently , we expect to see reaction from the marked area. We can see either decline toward new lows or larger 3 waves pull back at least.
You can learn more about Elliott Wave Double Three and Zig Zag Patterns at our Free Elliott Wave Educational Web Page.
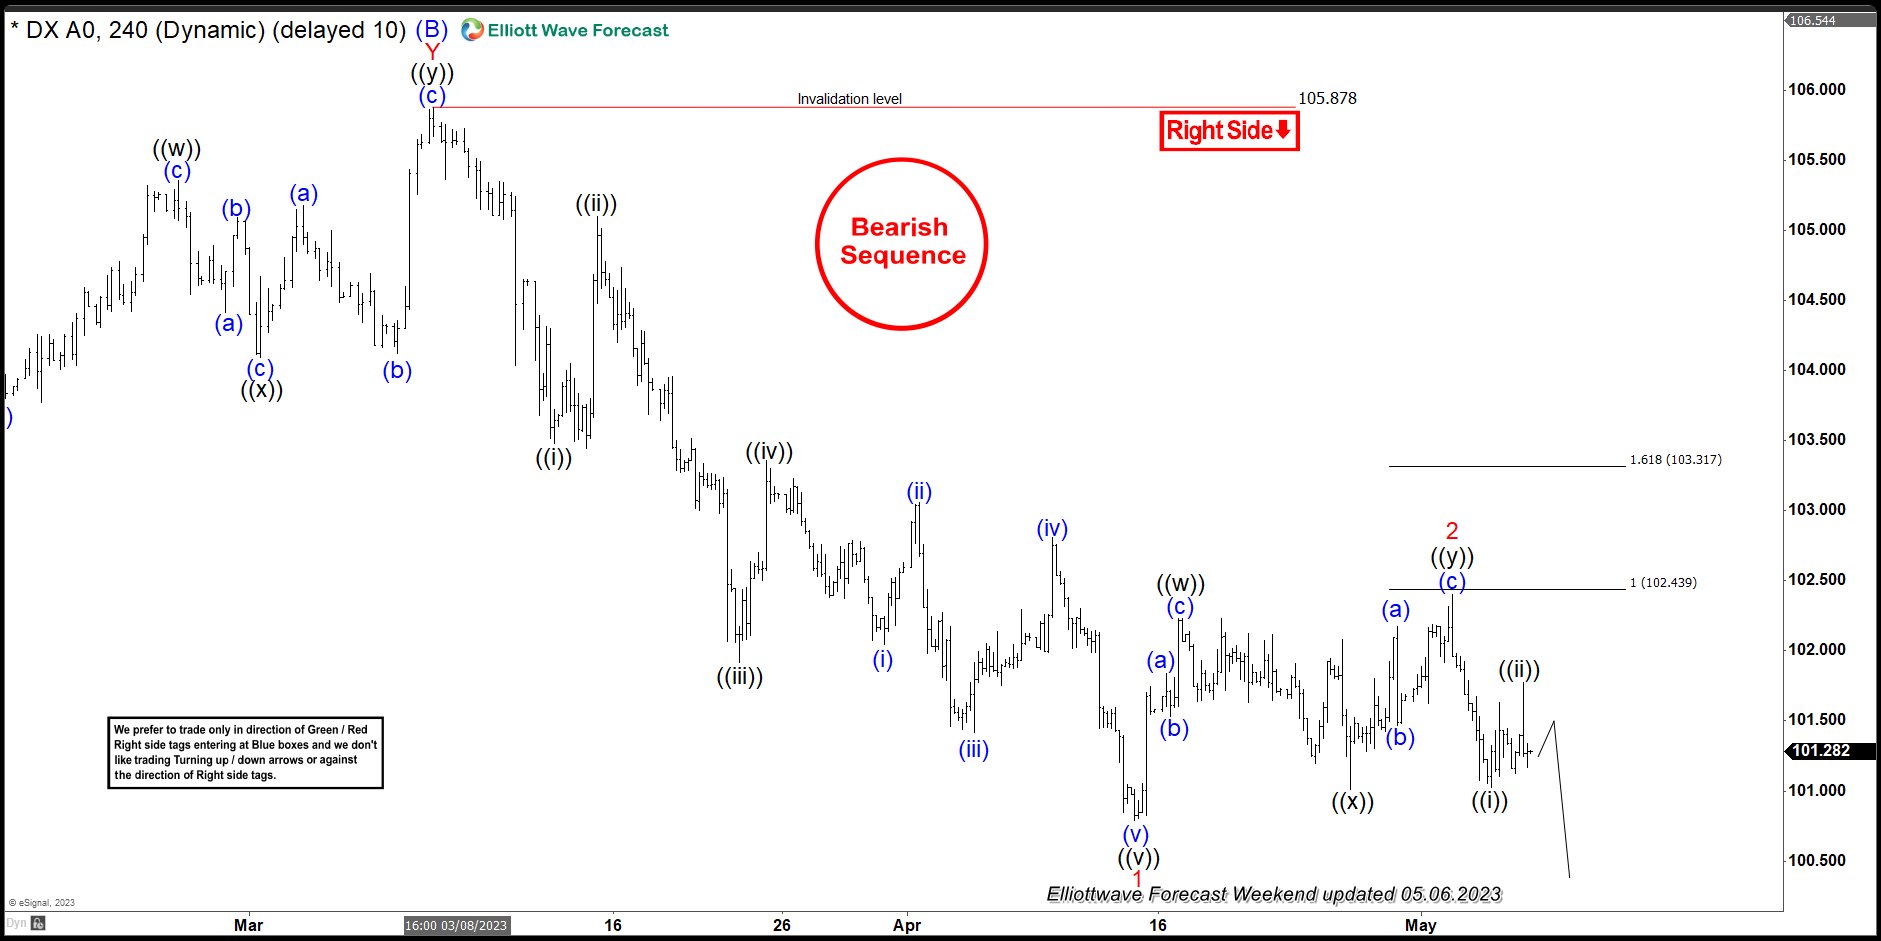
USDX 1h Hour Elliott Wave Analysis 05.06.2023
USDX made extension higher and almost reached 102.43 area. It found sellers and made decline as we expected. Current view suggests 2 red recovery completed at 102.4 high. As far as the price holds below that peak, further weakness should follow, otherwise larger correction can be taking place in 7 swings. We should wait for a break of 1 red low , which will confirm next leg down is in progress.
Keep in mind not every chart is trading recommendation. You can check most recent charts and new trading setups in the membership area of the site. Best instruments to trade are those having incomplete bullish or bearish swings sequences. We put them in Sequence Report and best among them are shown in the Live Trading Room.
Source: https://elliottwave-forecast.com/elliottwave/usdx-decline-elliott-wave-double-three/
