


Hello fellow traders,
As our members know we have had many profitable trading setups recently. In this technical article, we are going to present another Elliott Wave trading setup we got in SPX E-Mini ( ES_F ) . ES_F completed this correction precisely at the Equal Legs zone, referred to as the Blue Box Area. In the following sections, we will delve into the specifics of the Elliott Wave pattern observed , discuss the trading setup and present targets.
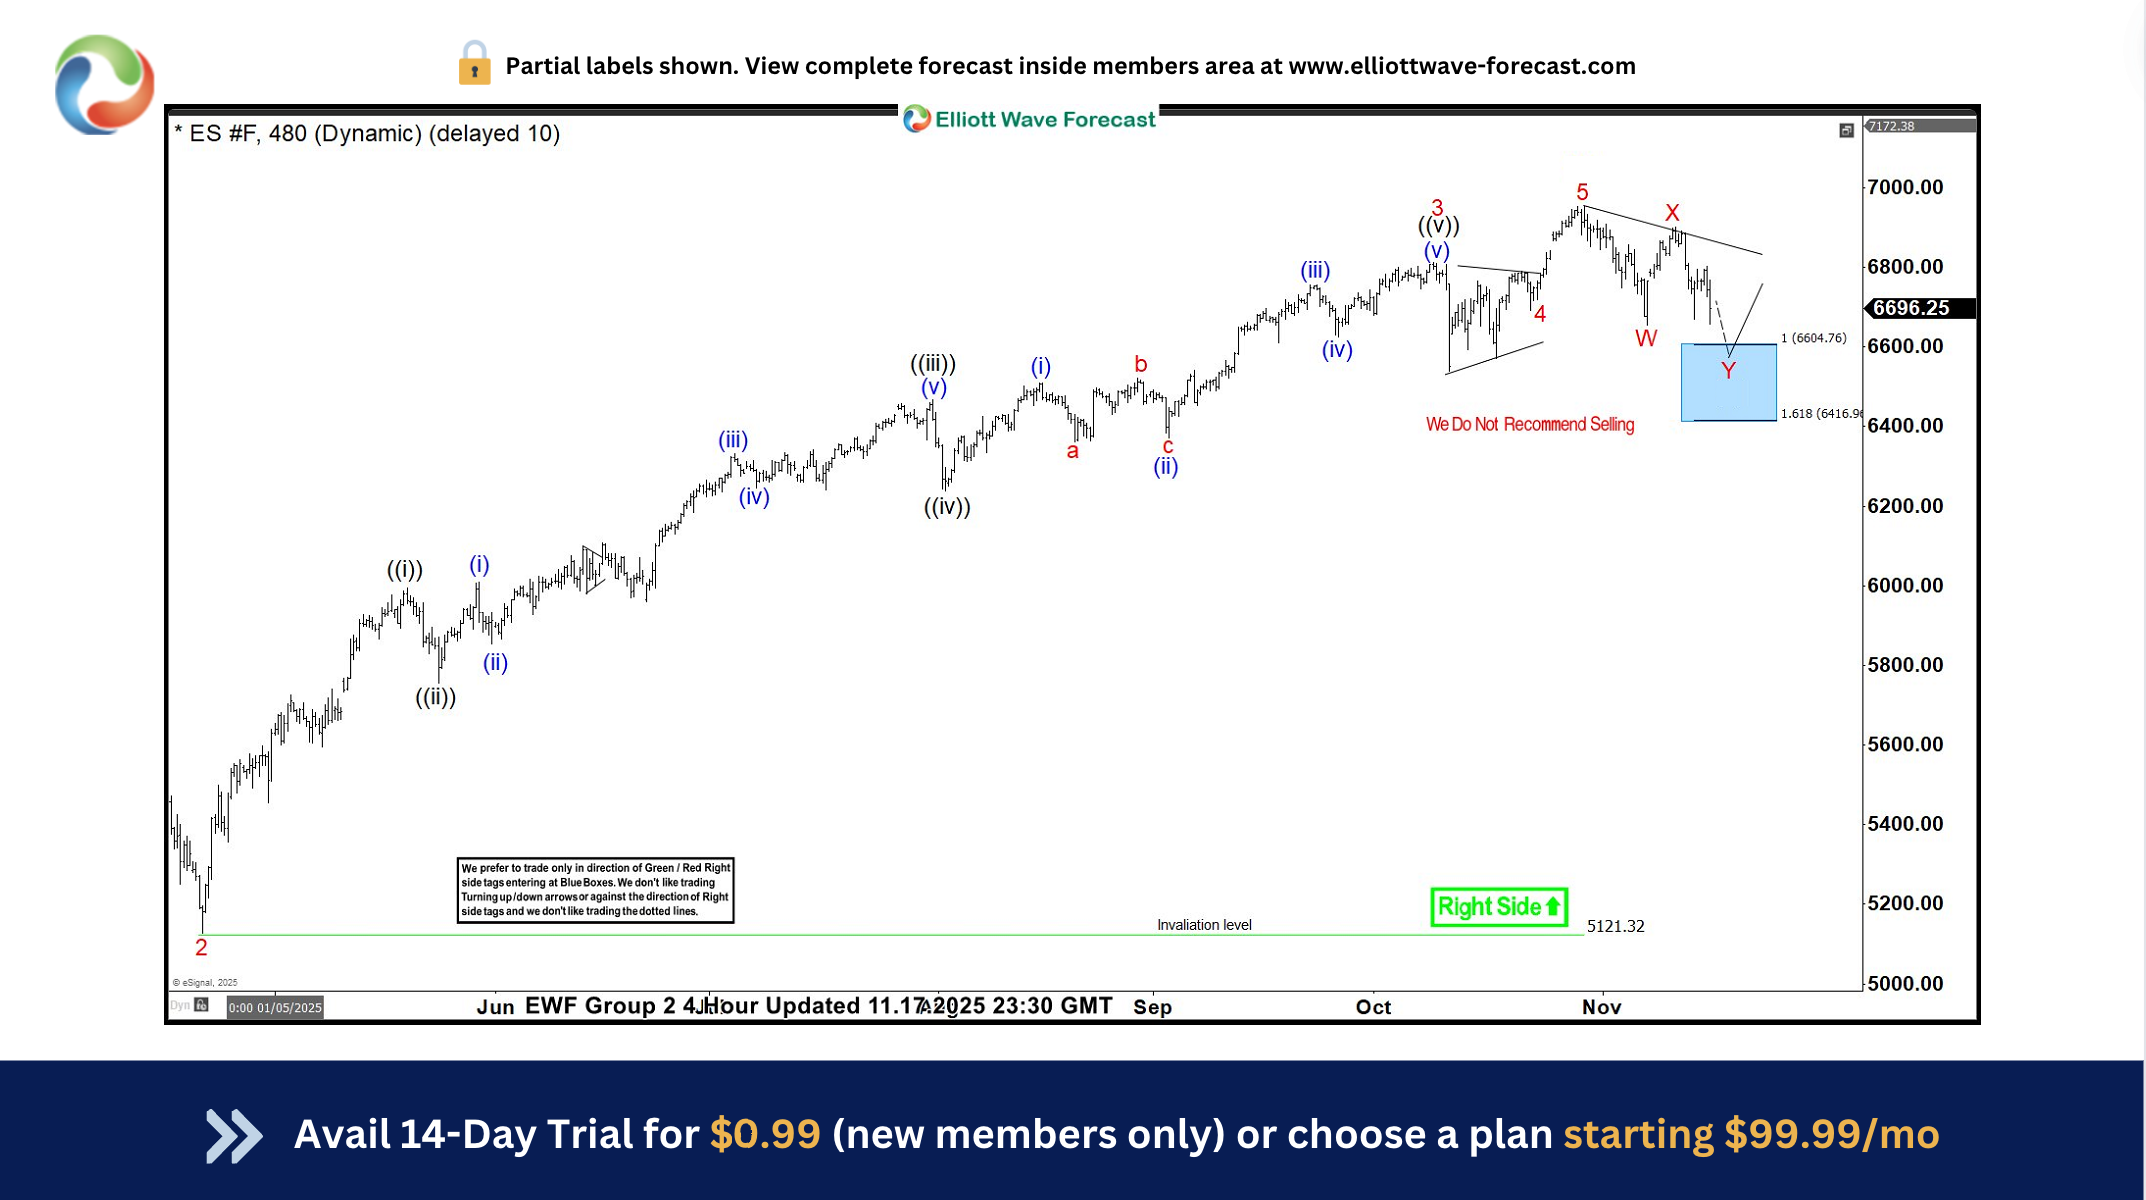
ES_F Elliott Wave 4 Hour Chart 11.17.2025
The current view suggests that ES_F is forming a Double Three correction (WXY red) . The price action shows an incomplete structure from the peak. We anticipate an extension toward the extreme zone at 6004.76-6416.9, where we are looking to re-enter as buyers.
We recommend members to avoid selling ES_F . As the main trend remains bullish, we anticipate at least a 3-wave bounce from this Blue Box area. Once the price touches the 50 fibs against the X red connector, we’ll make positions risk-free and set the stop loss at breakeven and book partial profits. On other hand, breaking below the 1.618 Fibonacci extension level at 6416.9 would invalidate the trade.
Official trading strategy on How to trade 3, 7, or 11 swing and equal leg is explained in details in Educational Video, available for members viewing inside the membership area.
Quick reminder on how to trade our charts :
Red bearish stamp+ blue box = Selling Setup
Green bullish stamp+ blue box = Buying Setup
Charts with Black stamps are not tradable. 🚫
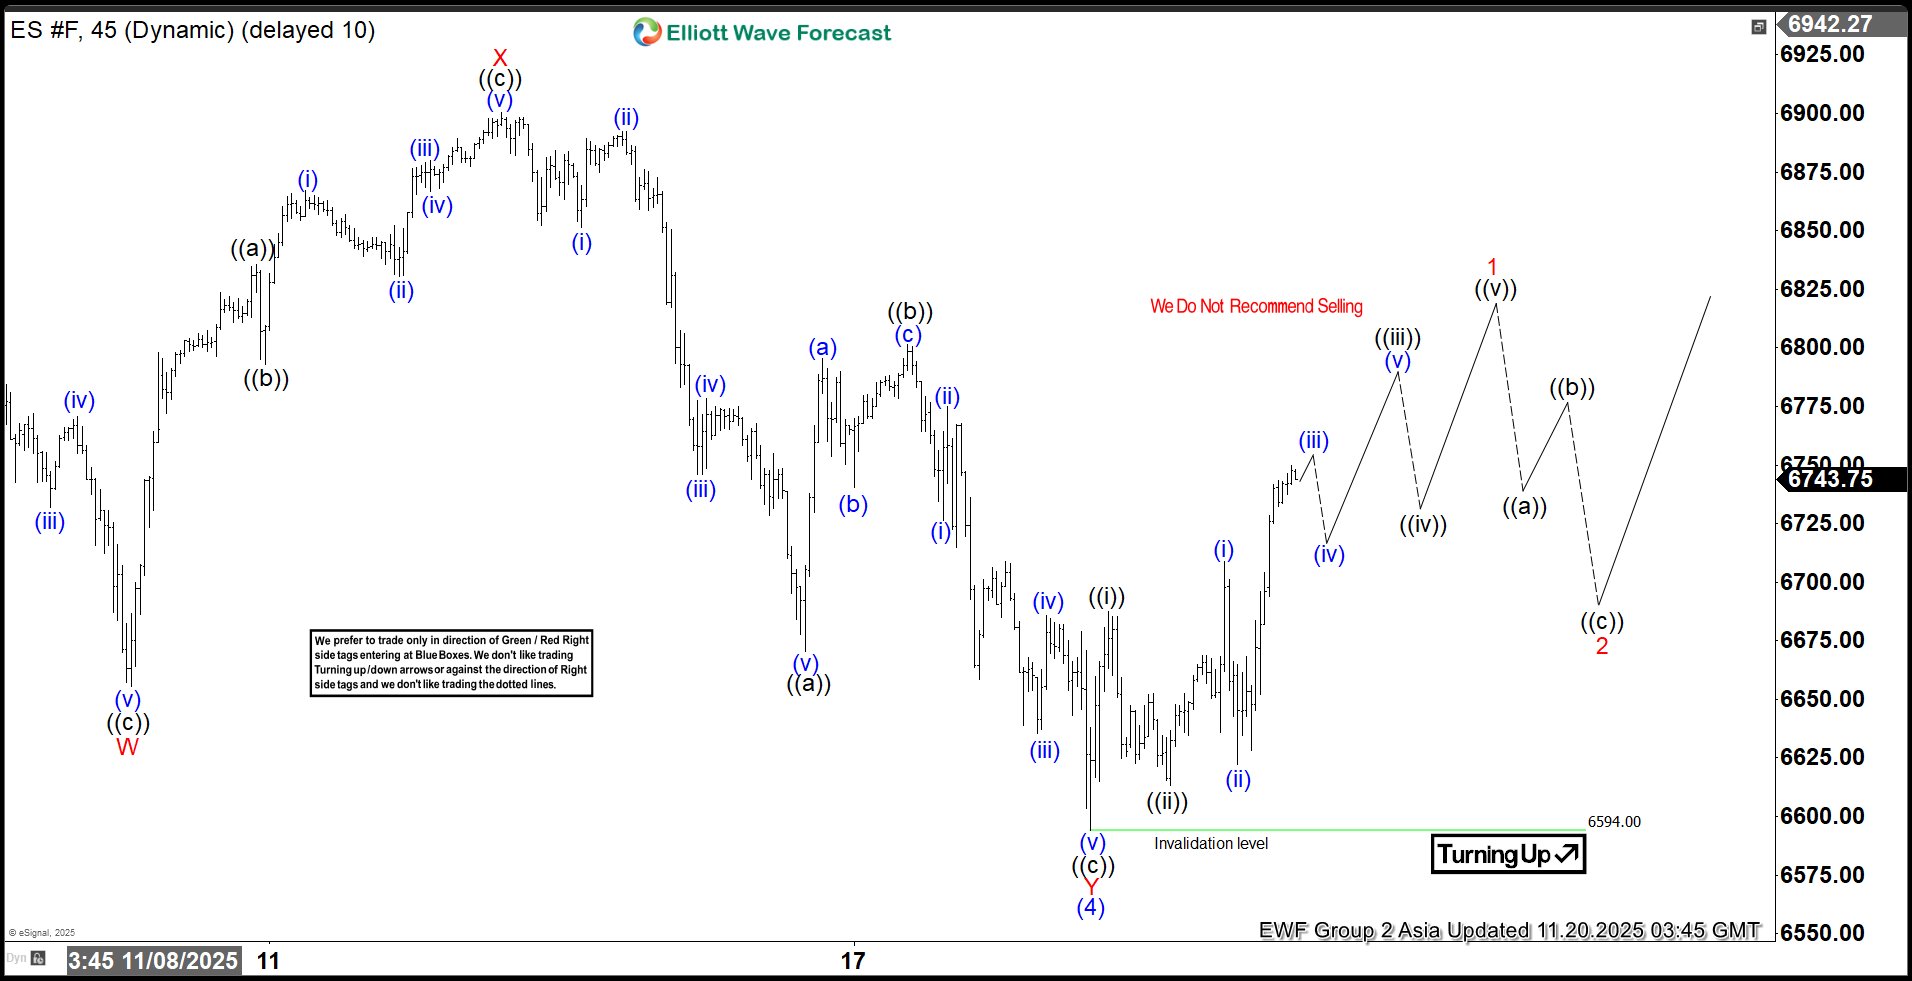
ES_F Elliott Wave 1 Hour Chart 11.17.2025
The futures has made extension down toward Blue Box (6004.76-6416.9,) and found buyers as expected. ES_F is showing a decent bounce from the Buying Zone. The reaction reaches 50 Fibs zone against the X red connector. Consequently, any long positions from the Blue Box should now be risk-free. We’ve set our stop loss at breakeven and have already secured partial profits. We count correction completed at 6594 low. While above that level, ES_F can be heading toward 7031 + area.
90% of traders fail because they don’t understand market patterns. Are you in the top 10%? Test yourself with this advanced Elliott Wave Test
Reminder for members: Our chat rooms in the membership area are available 24 hours a day, providing expert insights on market trends and Elliott Wave analysis. Don’t hesitate to reach out with any questions about the market, Elliott Wave patterns, or technical analysis. We’re here to help.
Source: https://elliottwave-forecast.com/stock-market/sp-500-e-mini-es_f-elliott-wave-blue-box/
