Hello fellow traders. In this technical blog we’re going to take a quick look at the past Elliott Wave chart of Nikkei (NKD #F) published in members area of www.elliottwave-forecast.com. In further text we’re going to explain our view and the Elliott Wave count.
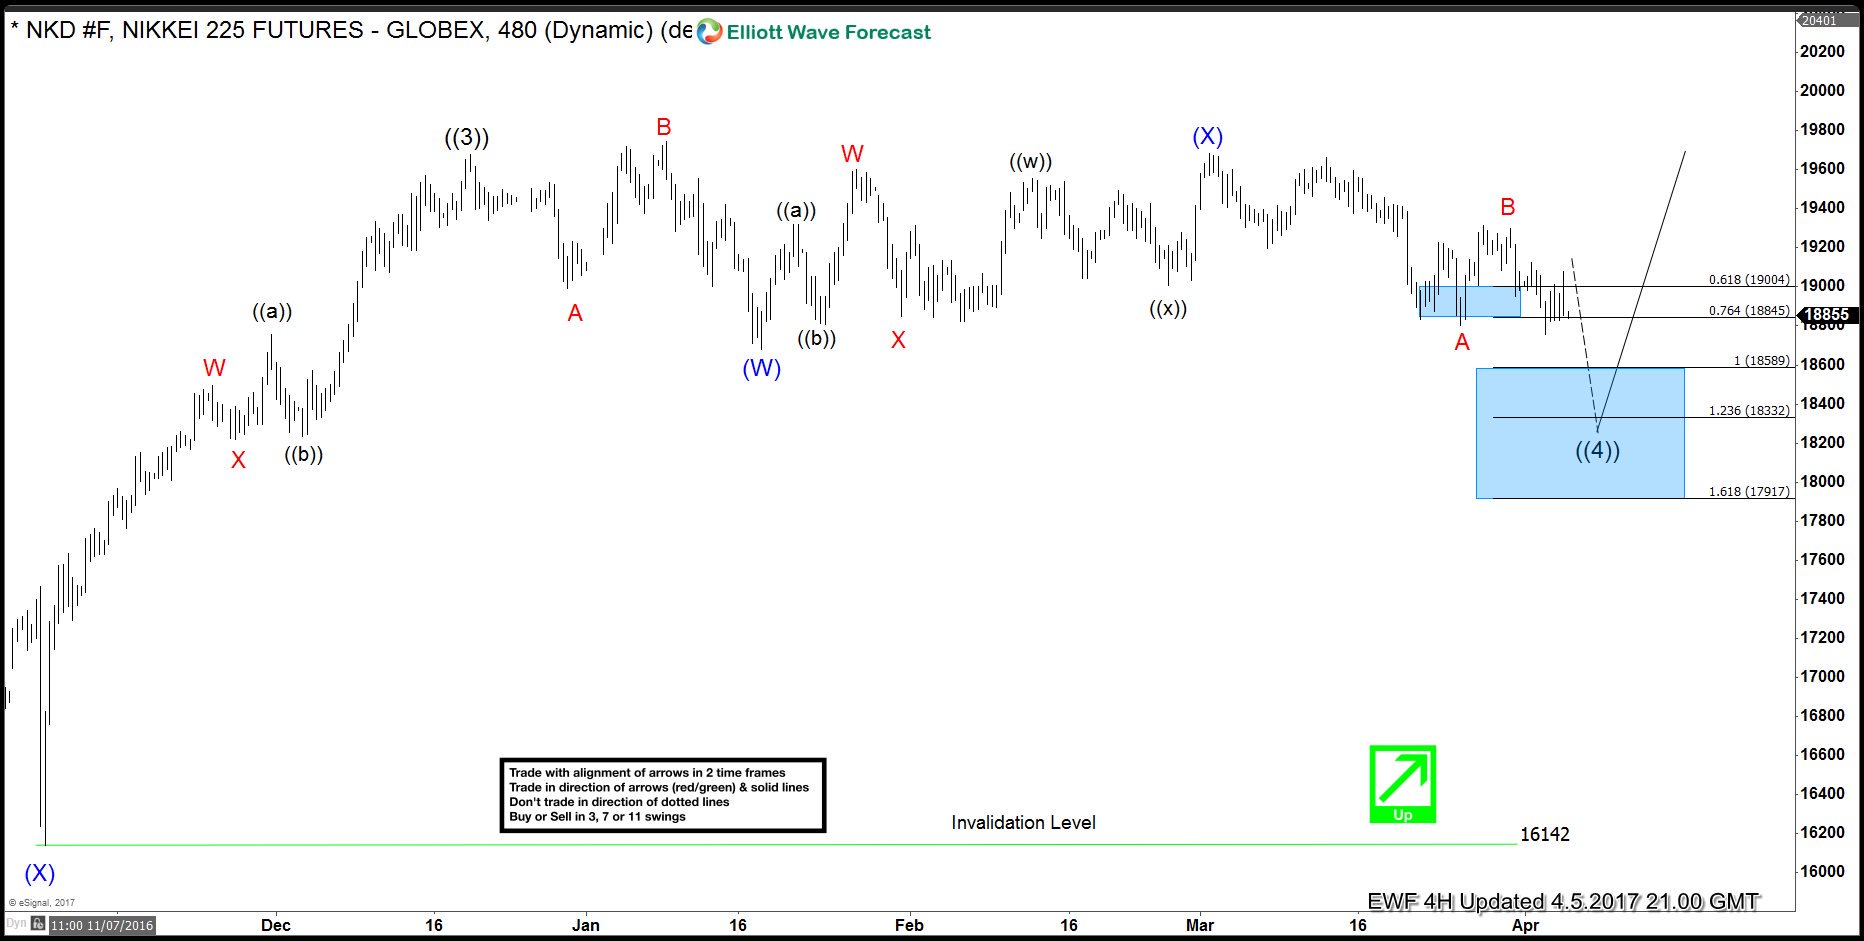
Nikkei (NKD #F) Elliott Wave 4 Hour Chart 04.05.2017
As our members know, we were pointing out that Nikkei is supported due to its bulish sequences in weekly time frame and correlation. We recommended members to wait for the price to reach the extremes at lower levels, before buying it. Structure has been pretty sideways, but calling for more short term weakness in 7th swing toward 18589- 18332 area ( potential buying zone). Index needed another leg lower in wave C red of (Y) blue ,before wave ((4)) pull back becomes ready to complete as Double Three Pattern. As Nikkei was bullish in higher time frames, we recommended our members to avoid selling , and keep buying the dips. Our buying zone was at 18589- 18332 area, when invalidation level was below 17917.
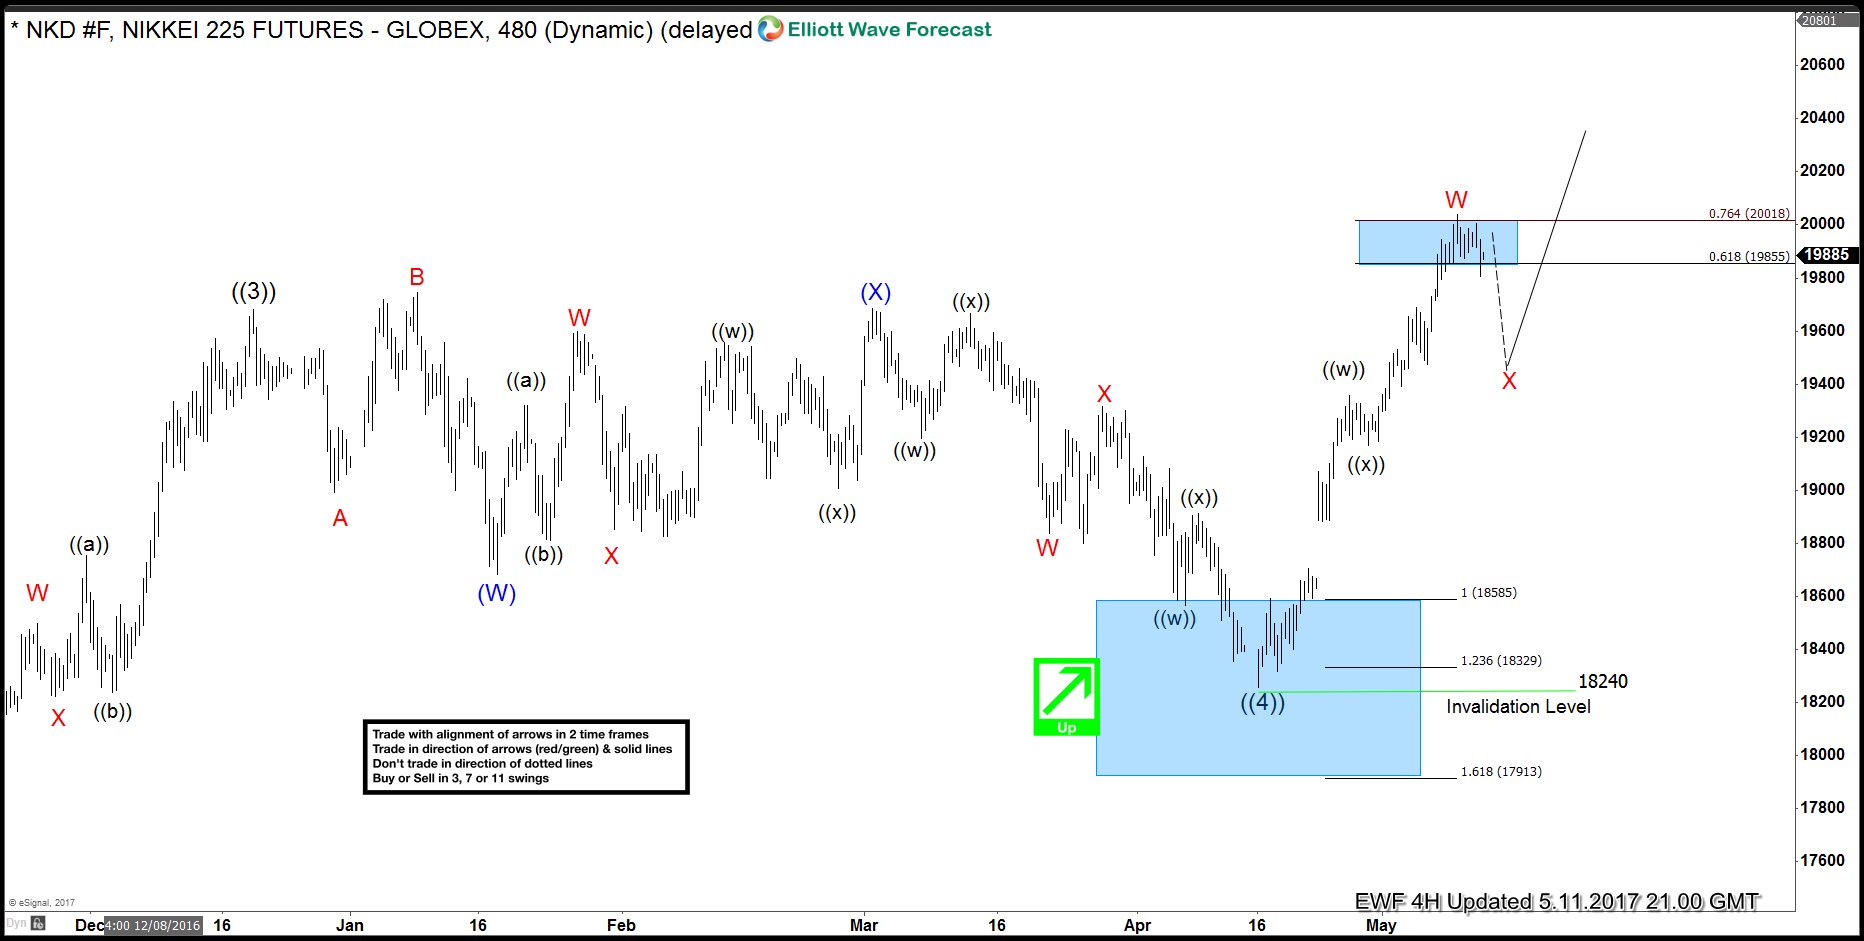
Nikkei (NKD #F) Elliott Wave 4 Hour Chart 05.11.2017
Eventually Nikkei has reached proposed buying zone, found buyers and turned higher as expected. Wave ((4 )) pull back is counted completed at 18240 low, and now index is bearish against that level. Current Elliott Wave forecasts suggests that 19855-20018 area can produce 3 wave pull back. As far as the price holds below current short term high wave X red pull back is in progress. We don’t advise selling the index, and suggests members to remain long within risk free positions.
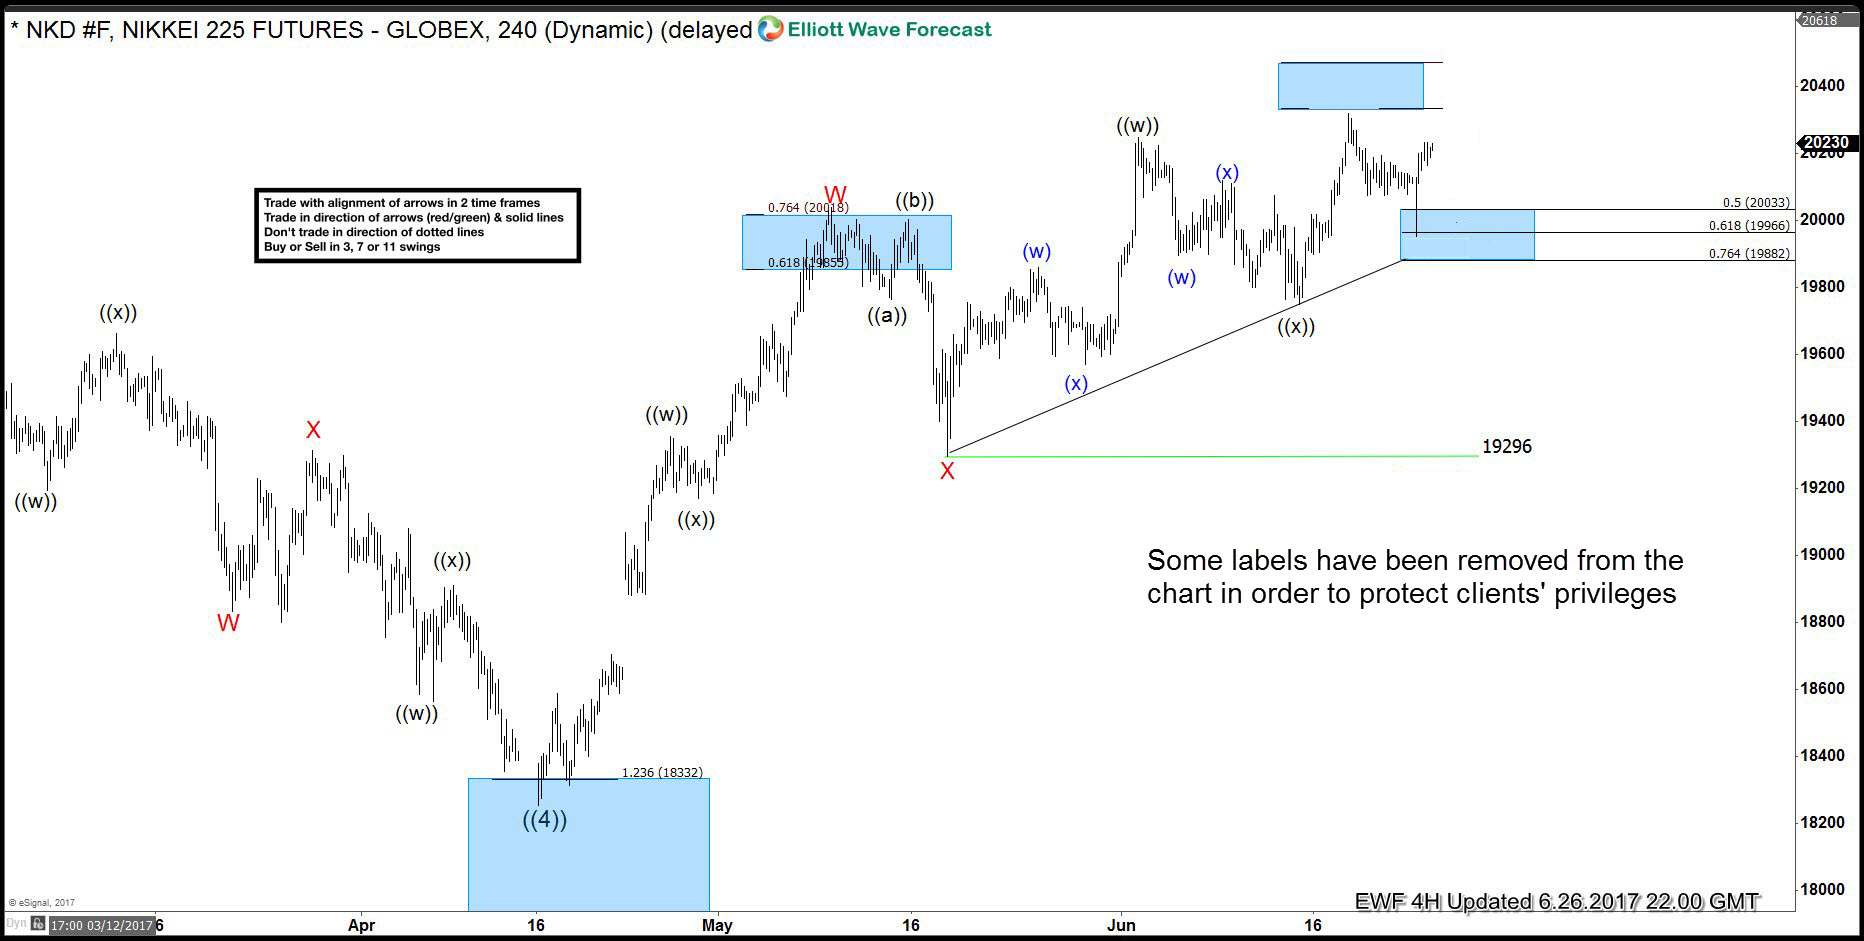
Nikkei (NKD #F) Elliott Wave 4 Hour Chart 06.26.2017
We got proposed X red pull back from 19855-20018 area that has completed at 19296 . The index has made rally , reaching new highs as forecasted.
Note : some labels have been removed from the chart in order to protect clients privileges. Keep in mind market is very dynamic. If you’re interested new forecasts of Nikkei you can find them in the membership area of EWF.
Elliott Wave Forecast
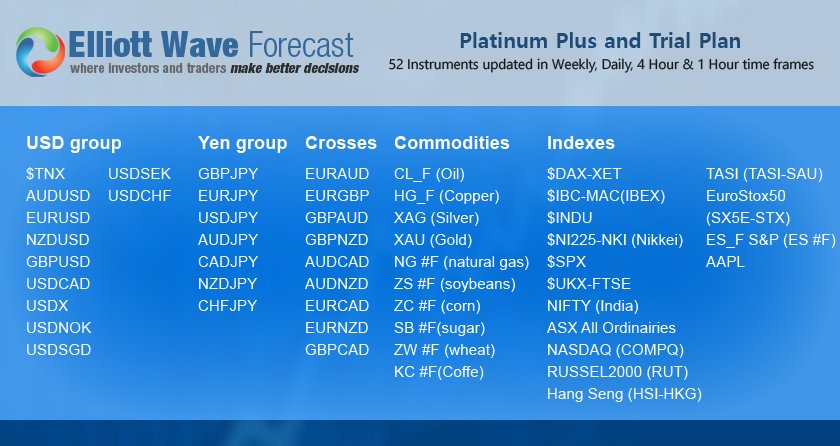
We cover 52 instruments in total. If not a member yet, Sign Up for Free Trial now and get access to new trading opportunities.
Through time we have developed a very respectable trading strategy which defines Entry, Stop Loss and Take Profit levels with high accuracy and allows you to make position Risk Free, shortly after taking it. If you want to learn all about it and become a professional Trader, join us now for Free.