Hello fellow traders. In this technical blog we’re going to present the past Elliott Wave charts of Hang Seng ( $HSI-HKG ) published in members area of www.elliottwave-forecast.com . As our members know, we were pointing out that Hang Seng is having incomplete bullish swings sequences in the cycles from the February 12th and December 30th 2016 lows. We advised members to avoid selling the index and keep buying the dips in 3,7,11 swings. In further text we’re going to take a look at our past forecasts, count the swings and see how we guided our members through this instrument.
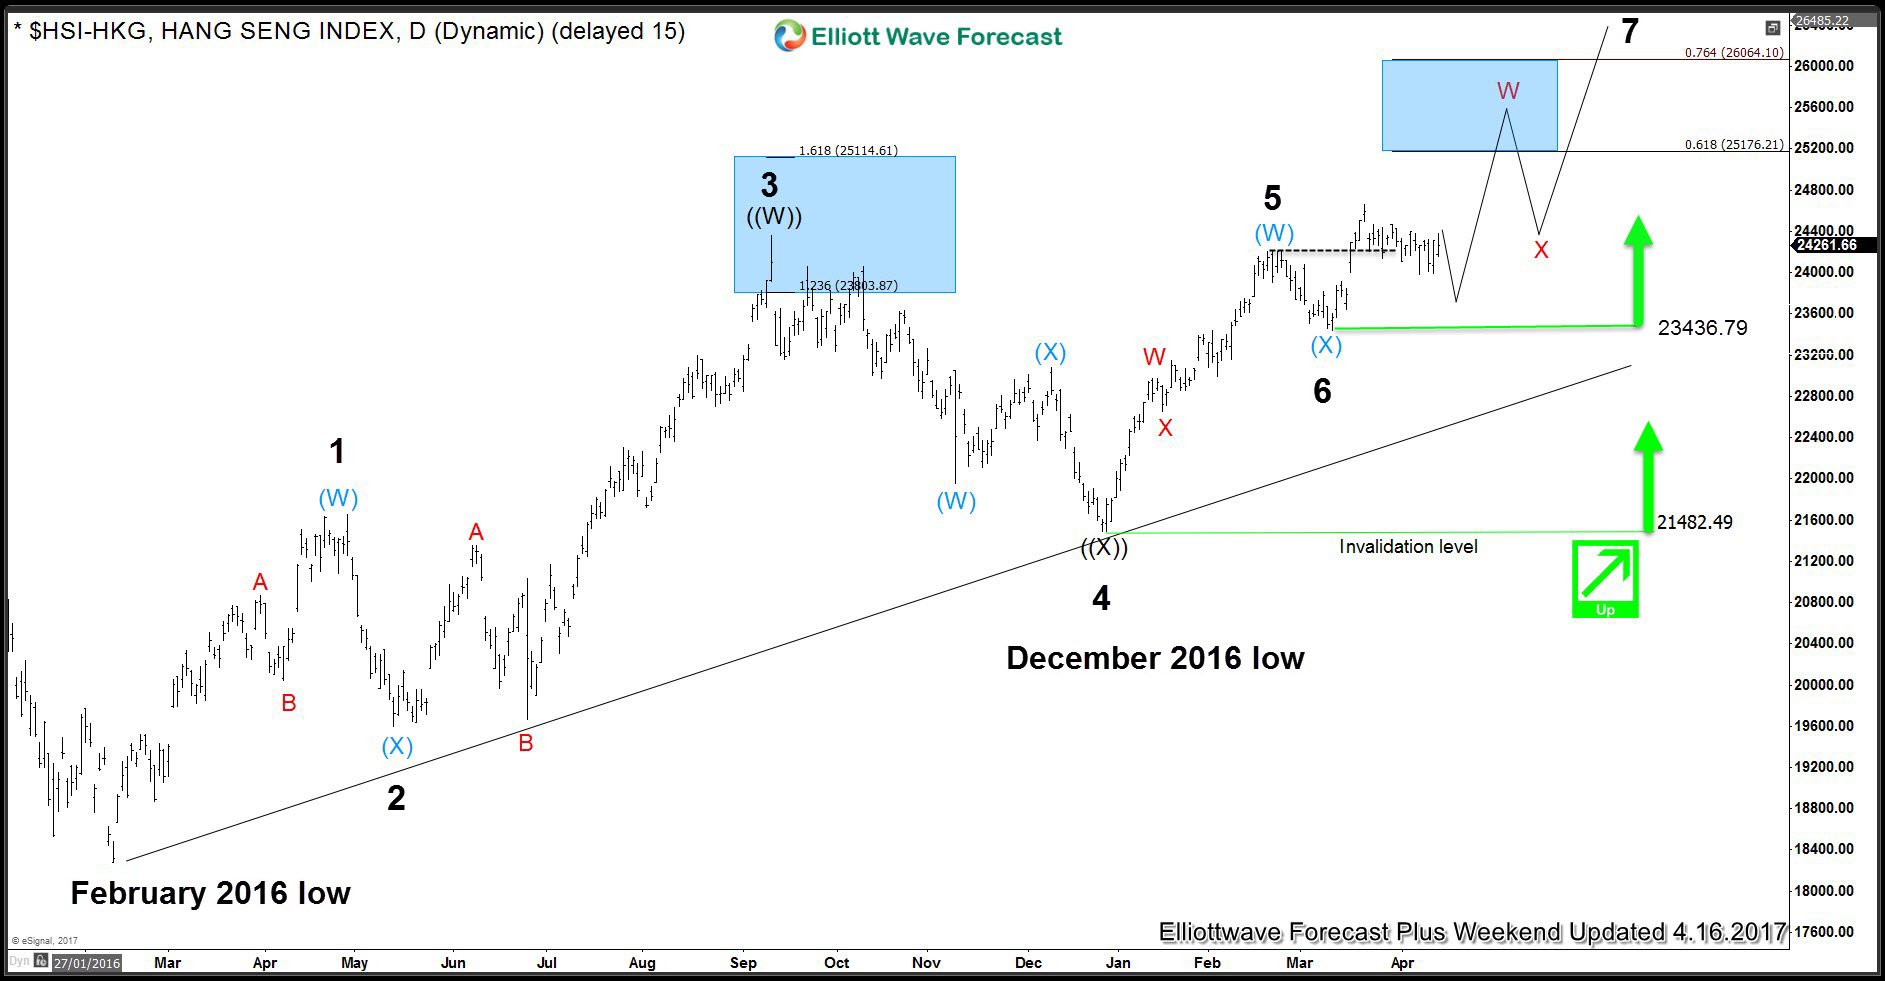
HANG SENG HSI-HKG Daily chart 04.17.2017
At the chart below we can see 2 incomplete bullish cycles from the February’s and December’s lows. The index remains buy in a dips against the 23436.79 and 21482.4 pivots. First target area to the upside comes at 25176.21-26064.1
Now, let’s take a look at the short term structures to see where the entries were.
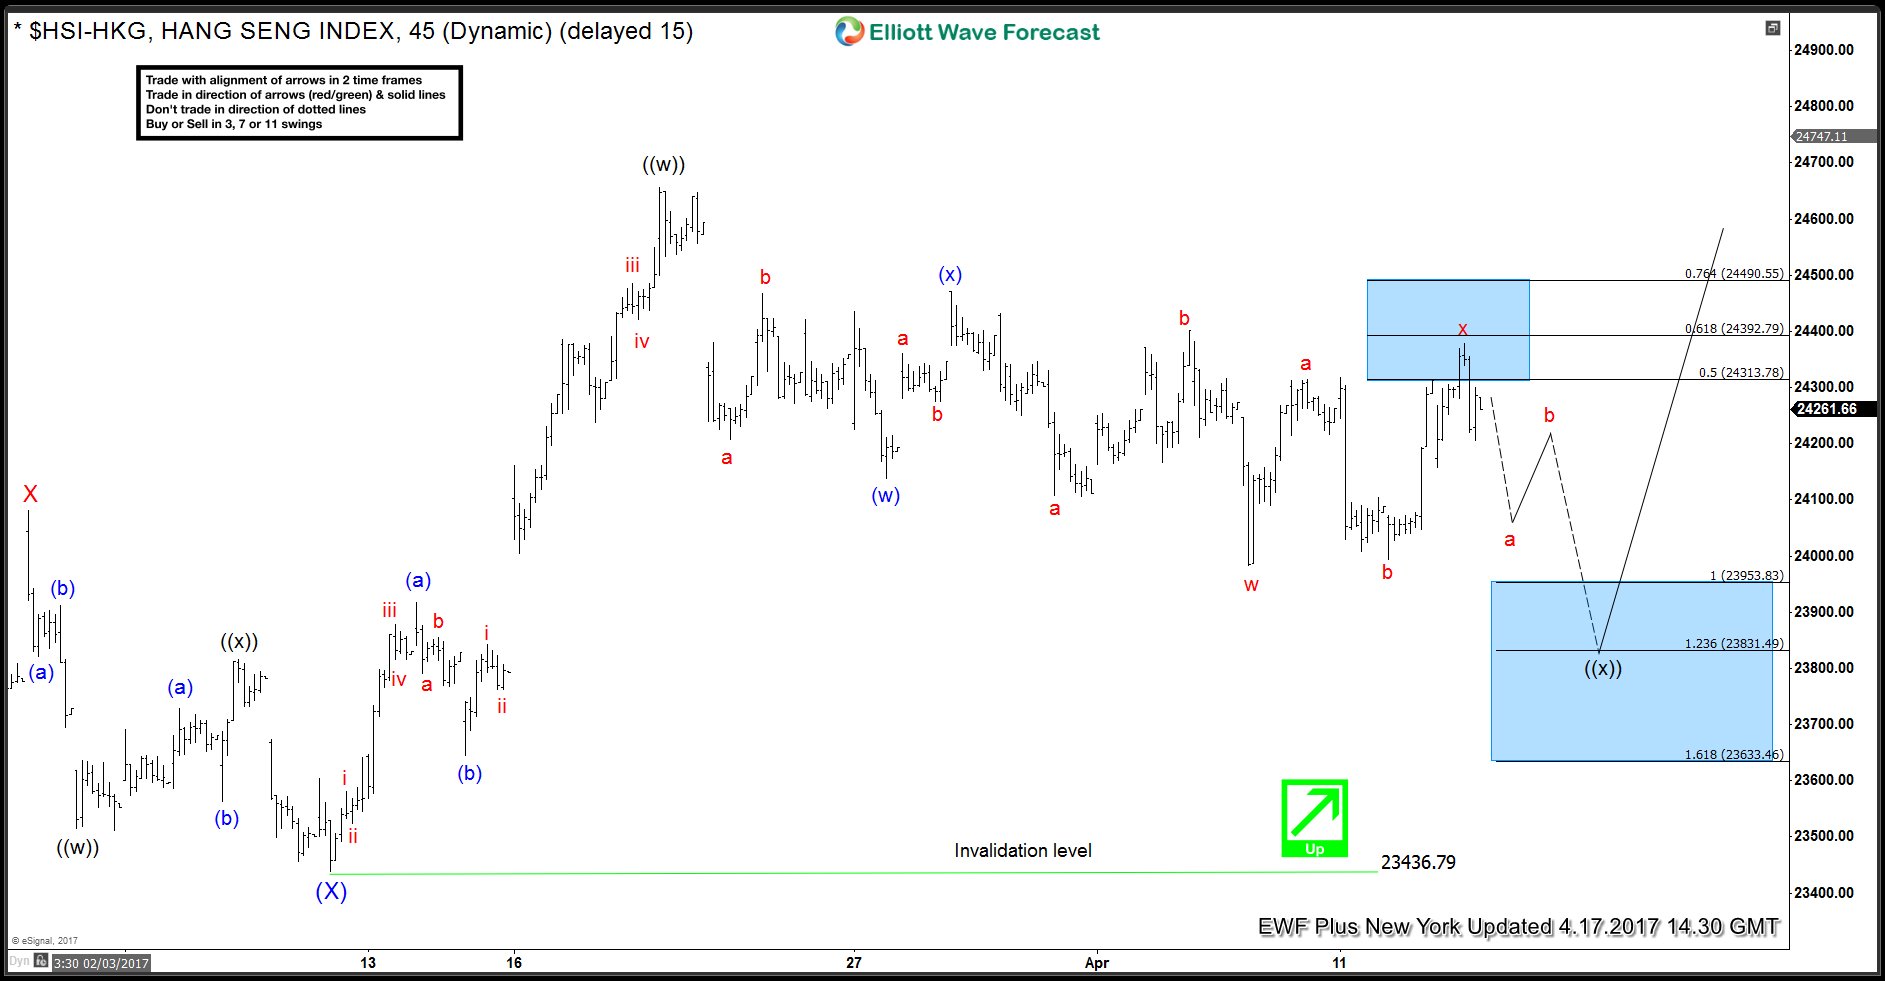
HANG SENG HSI-HKG 1 Hour chart 04.17.2017
The index is correcting cycle from the 23436.79 low, looking for another leg lower toward 23953.8-23633.4 ( potential buy zone) . Our forecast is calling for more strength once ((x)) pull back completes as Double three structure.
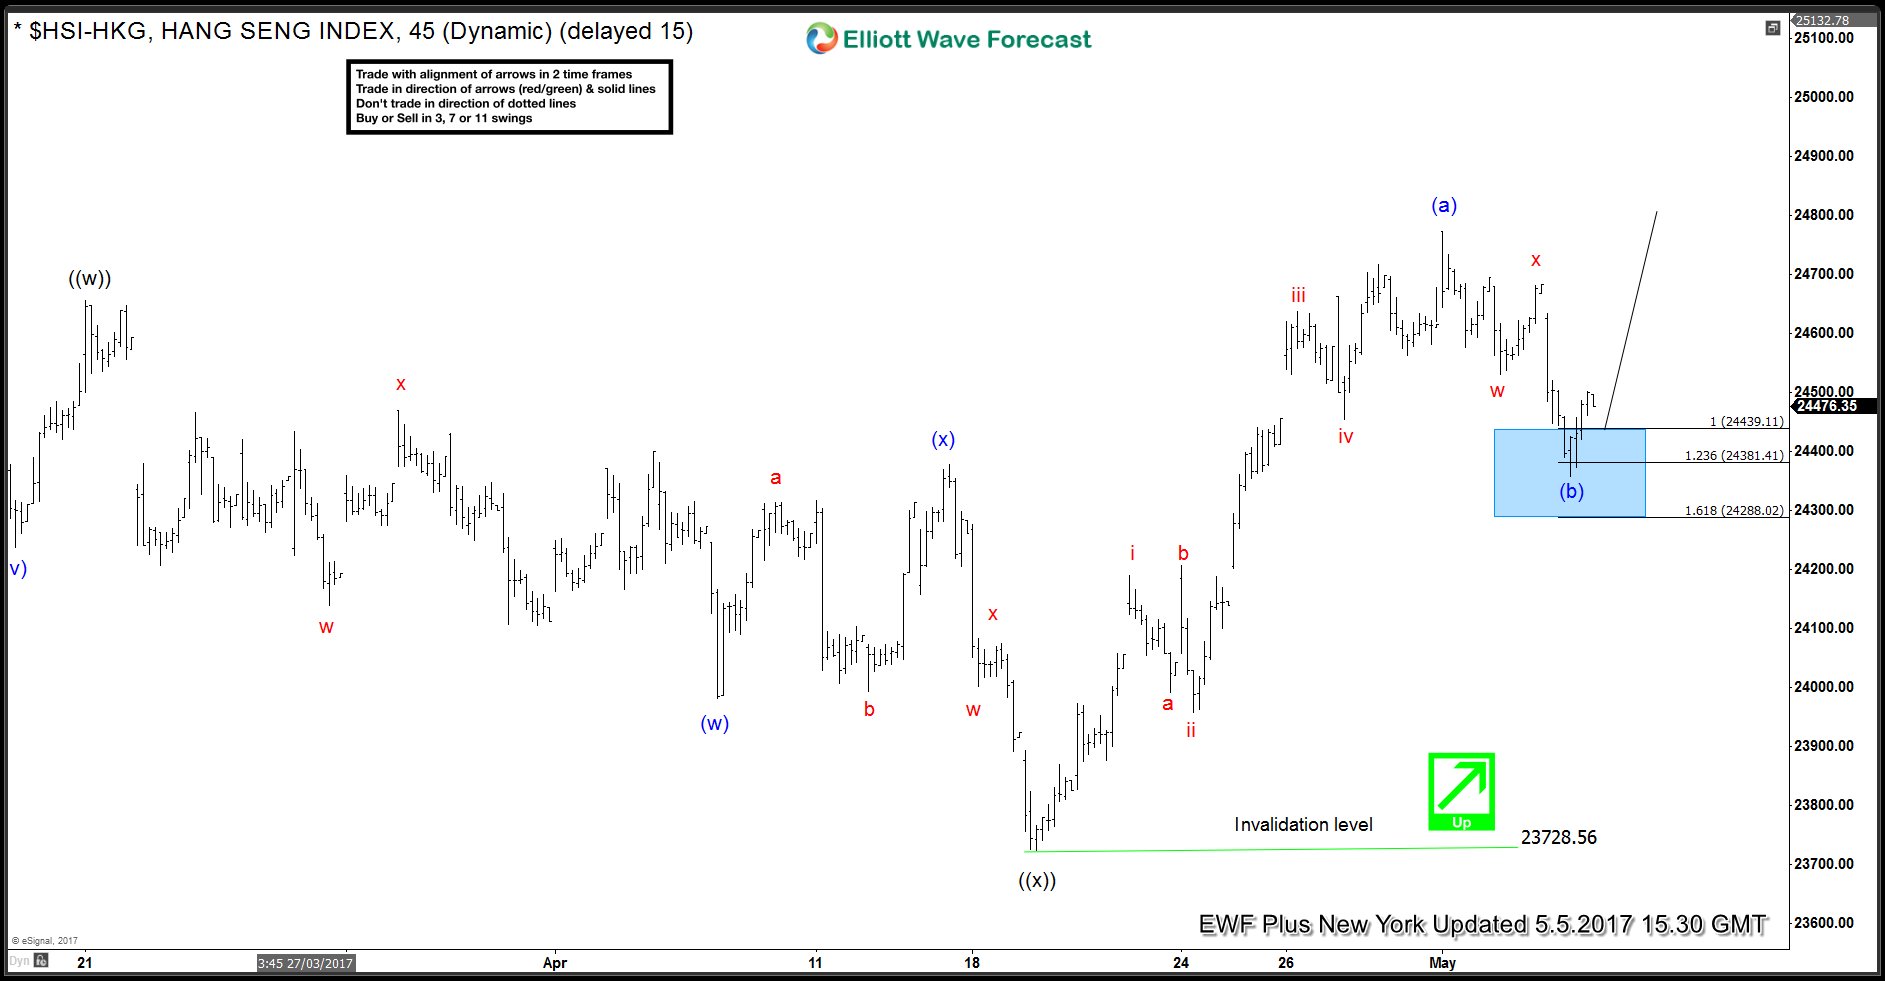
HANG SENG HSI-HKG 1 Hour chart 05.05.2017
Wave ((x)) correction reached proposed tech area at 23953.8-23633.4. The index found buyers as expected and made a nice rally from there. Wave ((x)) connector ended at 23728.56 low and we’re now having 5 waves rally from that low, labeled as wave (a) blue. Wave (b) pull back reached inner equal legs , and traders who missed entry from previous chart, can jump now in long trades at 24439.11-24288.02 area.
Note: Some labels have been removed in order to protect client’s privileges. Success in trading requires proper risk/money management, so does understanding of Elliott Wave theory, Cycle and Correlation analysis . If you’re interested in the future path of any of 50 instruments we cover, you can find Elliott Wave analysis in the membership area of EWF. ( If not a member yet, you have opportunity to take 14 Days Free Trial )
Through time we have developed a very respectable trading strategy. If you want to learn all about it and become a professional Trader, join us now for Free.
Welcome to EWF !