


IBB ( iShares NASDAQ Biotechnology Index ETF ) tracks the performance of a market-cap-weighted index of biotechnology and pharmaceutical companies listed on the NASDAQ. In this Technical Blog we’re going to take a quick look at the past Elliott Wave charts of IBB and we’re going to take a look at the price structures , count the swings and explain the forecast.
Early this year, the instrument made new highs and it was showing 5 swings from last year low which is considered as a bullish incomplete sequence. That’s why we were looking to buy the 6th swing pullback in 3 , 7 or 11 looking for a new leg to the upside or at least 3 waves bounce.
IBB Daily Swings 05/09/2017
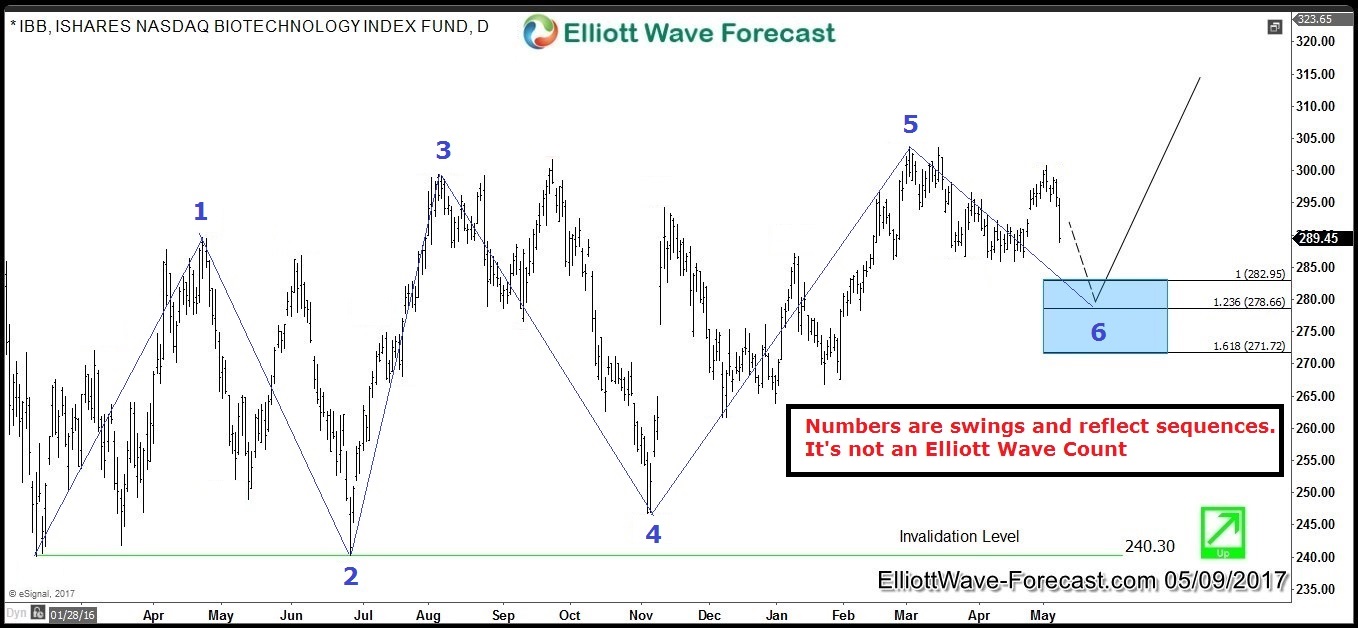
The first 3 waves pullback from March peak only gave a reaction higher, then IBB turned lower looking to do the Double Three Correction toward equal legs area 282.95 – 278.66 where buyers were expected to show up to support the Index.
IBB Daily Chart 05/31/2017
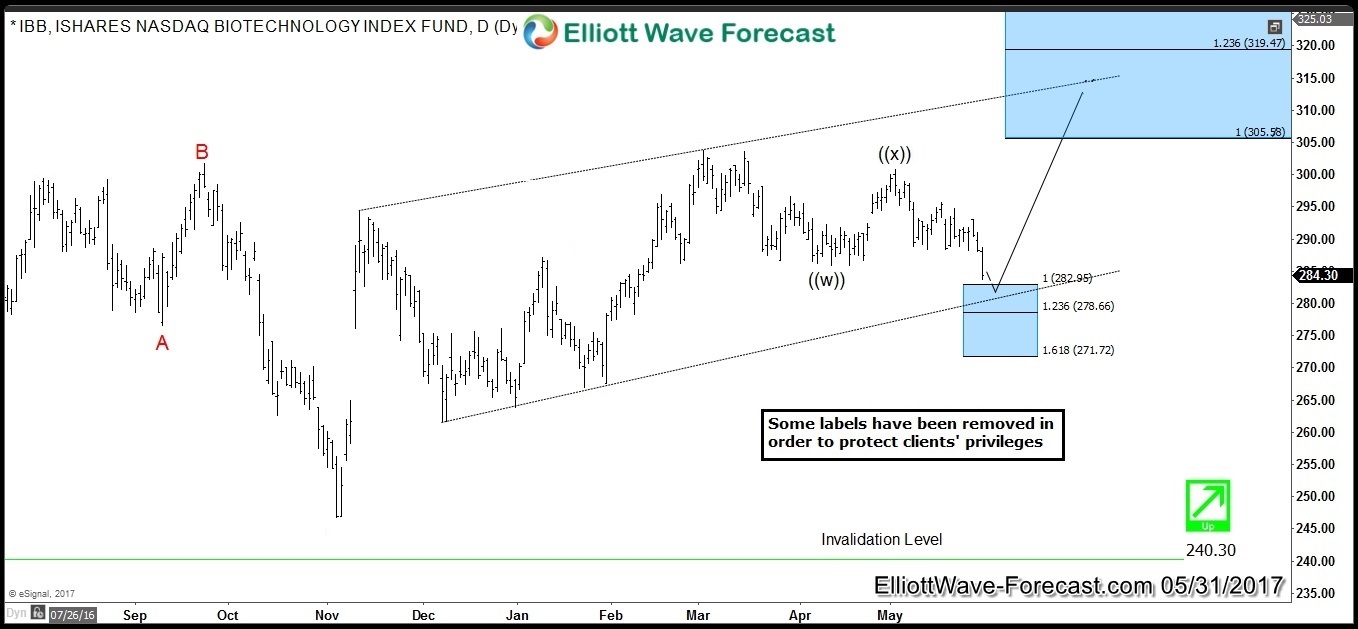
On 05/31, IBB bounced perfectly from 100% of the move from 03/02 peak and then the instrument was expected to resume to the upside. The bounce higher allowed buyers to protect their position and get risk free.
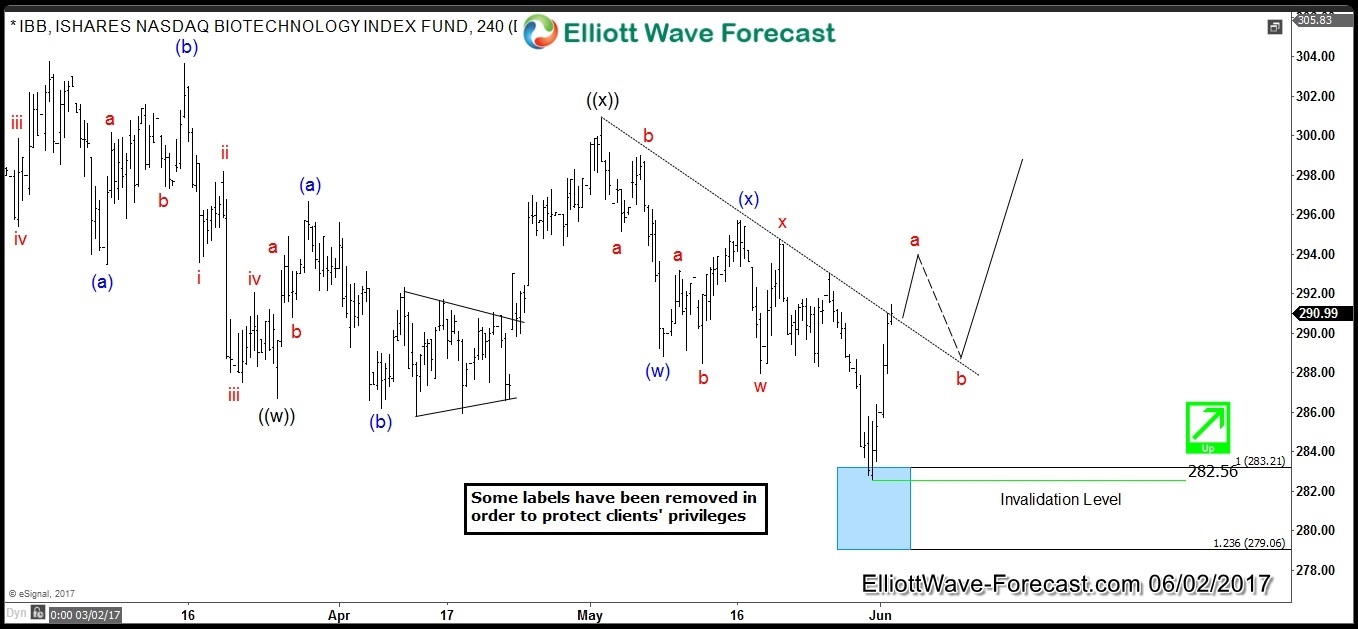
IBB 4H Chart 06/02/2017
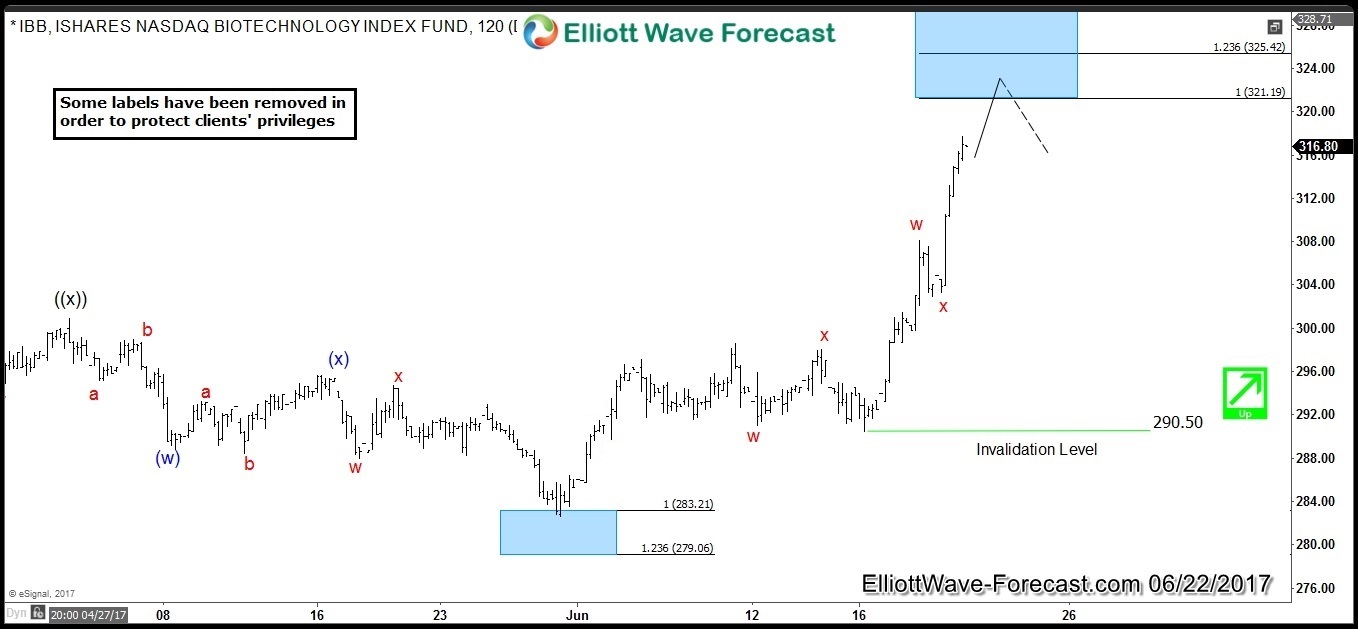
Finally, the index managed to make new highs above March peak and we were still calling for more extension to the upside. The first short term target area was achieved at 321 and pullbacks from there should remain supported in 3 , 7 or 11 swings while pivot at 290 low keeps holding.
IBB 4H Chart 06/22/2017
Soon, we will be launching a new plan covering Stocks & ETFs in 4 time frames. If you trade these type of instruments and interested in getting our updates then you can start by learning the basics of the Elliott Wave theory. Take this opportunity and try our services 14 days for FREE to learn how to to trade forex, indices, commodities and stocks using our blue boxes and the 3, 7 or 11 swings sequence . You will get access to our current 52 instruments updated in 4 different time frames, Live Trading Room and 2 Live Analysis Session done by our Expert Analysts every day, 24-hour chat room support and much more.
