


$FXA Currency ETF Long Term Cycles and Elliott Wave Analysis
The FXA ETF fund is the Australian dollar tracking fund that has an inception Date of 06/21/2006. With that said the fund mainly reflects the currency spot price of the AUDUSD pair. The data available from the Reserve Bank of Australia at their website suggests the spot price was 1.4875 back in 1973 to 1974 translates into an FXA price of around 148.75. The cycle analysis suggests a larger pullback cycle ended in March 2020.
Back before the FXA fund inception date, the AUDUSD spot currency price reached what is still the currency low in April 2001 at .4778. From there the currency pair went up in what appears to be a lead diagonal until July 2011 at a high of 1.1080. That translates into the FXA ETF fund price high of 110.99 in July 2011. This is where the monthly Elliott wave analysis begins on the chart below.
The analysis continues below the monthly chart.
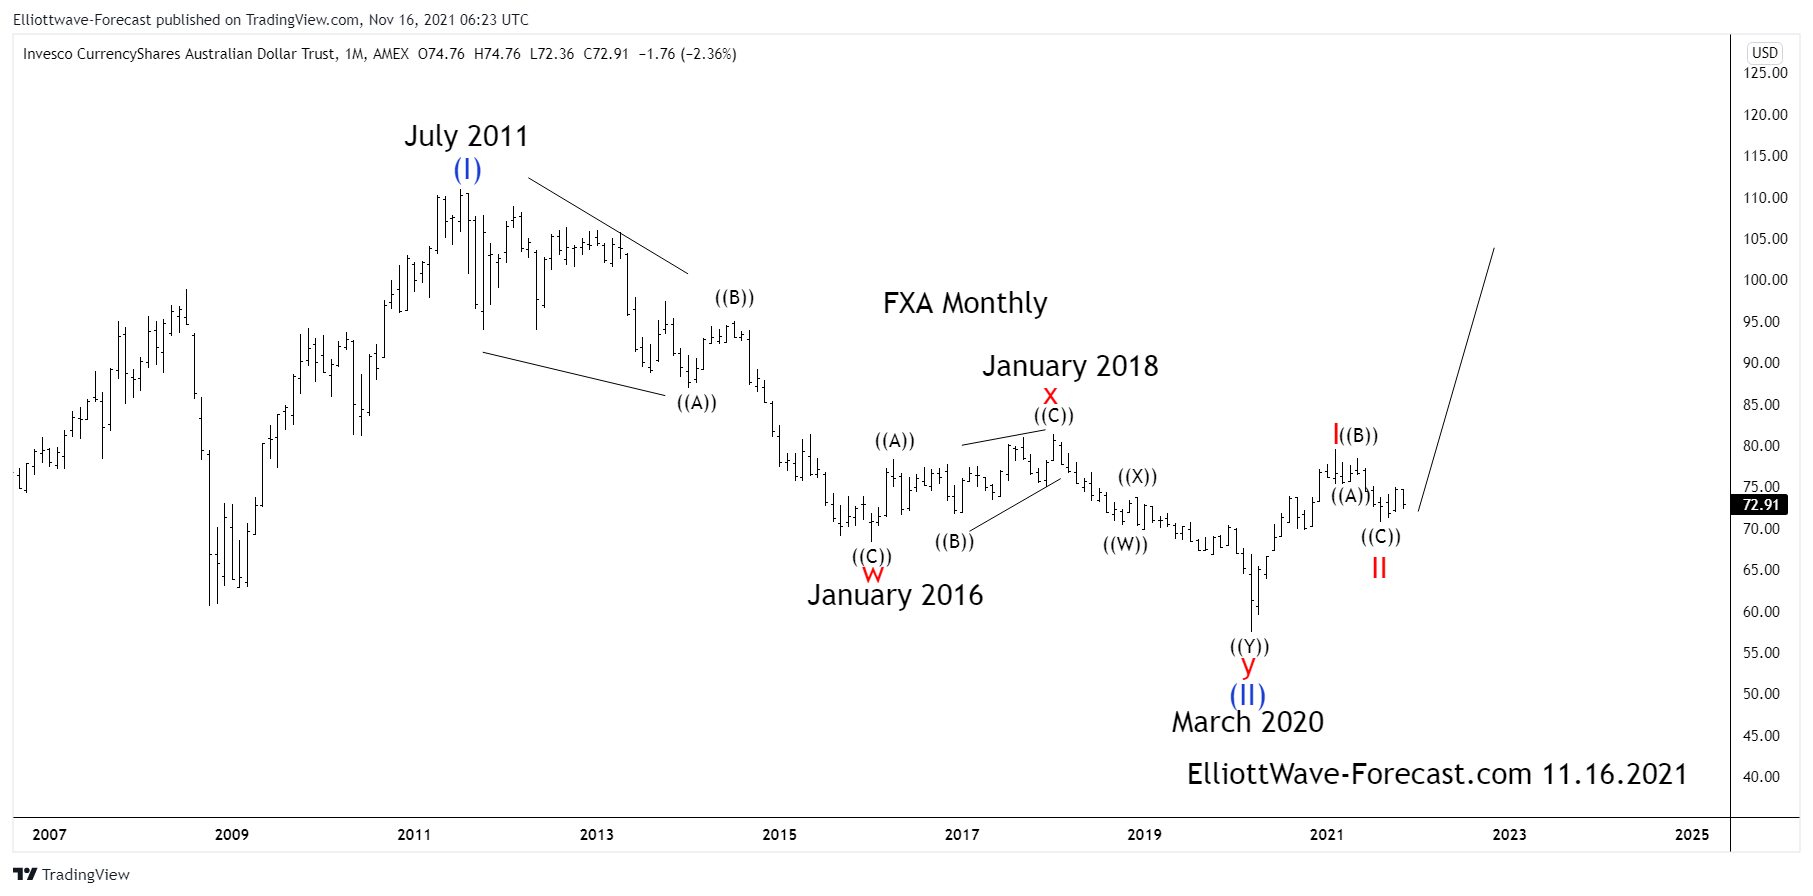
Secondly the decline from the aforementioned July 2011 highs does not seem legitimately able to count the whole cycle from there down to the January 2016 lows as a regular impulse by itself as a whole. The cycle lower in the red wave w has been subdivided as an ((A))-((B))-((C)) in black. The instrument has since then bounced in three swings. Further, this appeared to be a zig zag Elliott wave x in red that ended in January 2018.
Thirdly and in conclusion, since the wave x highs from January 2018 the instrument has declined in another Elliott Wave double three structure into the March 2020 lows. There it appears ended a larger pullback cycle. Lastly, from there it now appears the pair has finished correcting the cycle up from the March 2020 lows. This was in August 2021 on the 20th. While the pullback remains above there it should trend higher again.
