Hello fellow traders. In this technical blog we’re going to take a quick look at the past Elliott Wave charts of Dollar Index published in members area of www.elliottwave-forecast.com. We’re going to take a look at the price structures of USDX , count the swings and explain the forecast.
USDX 4 hour update 05.09.2017
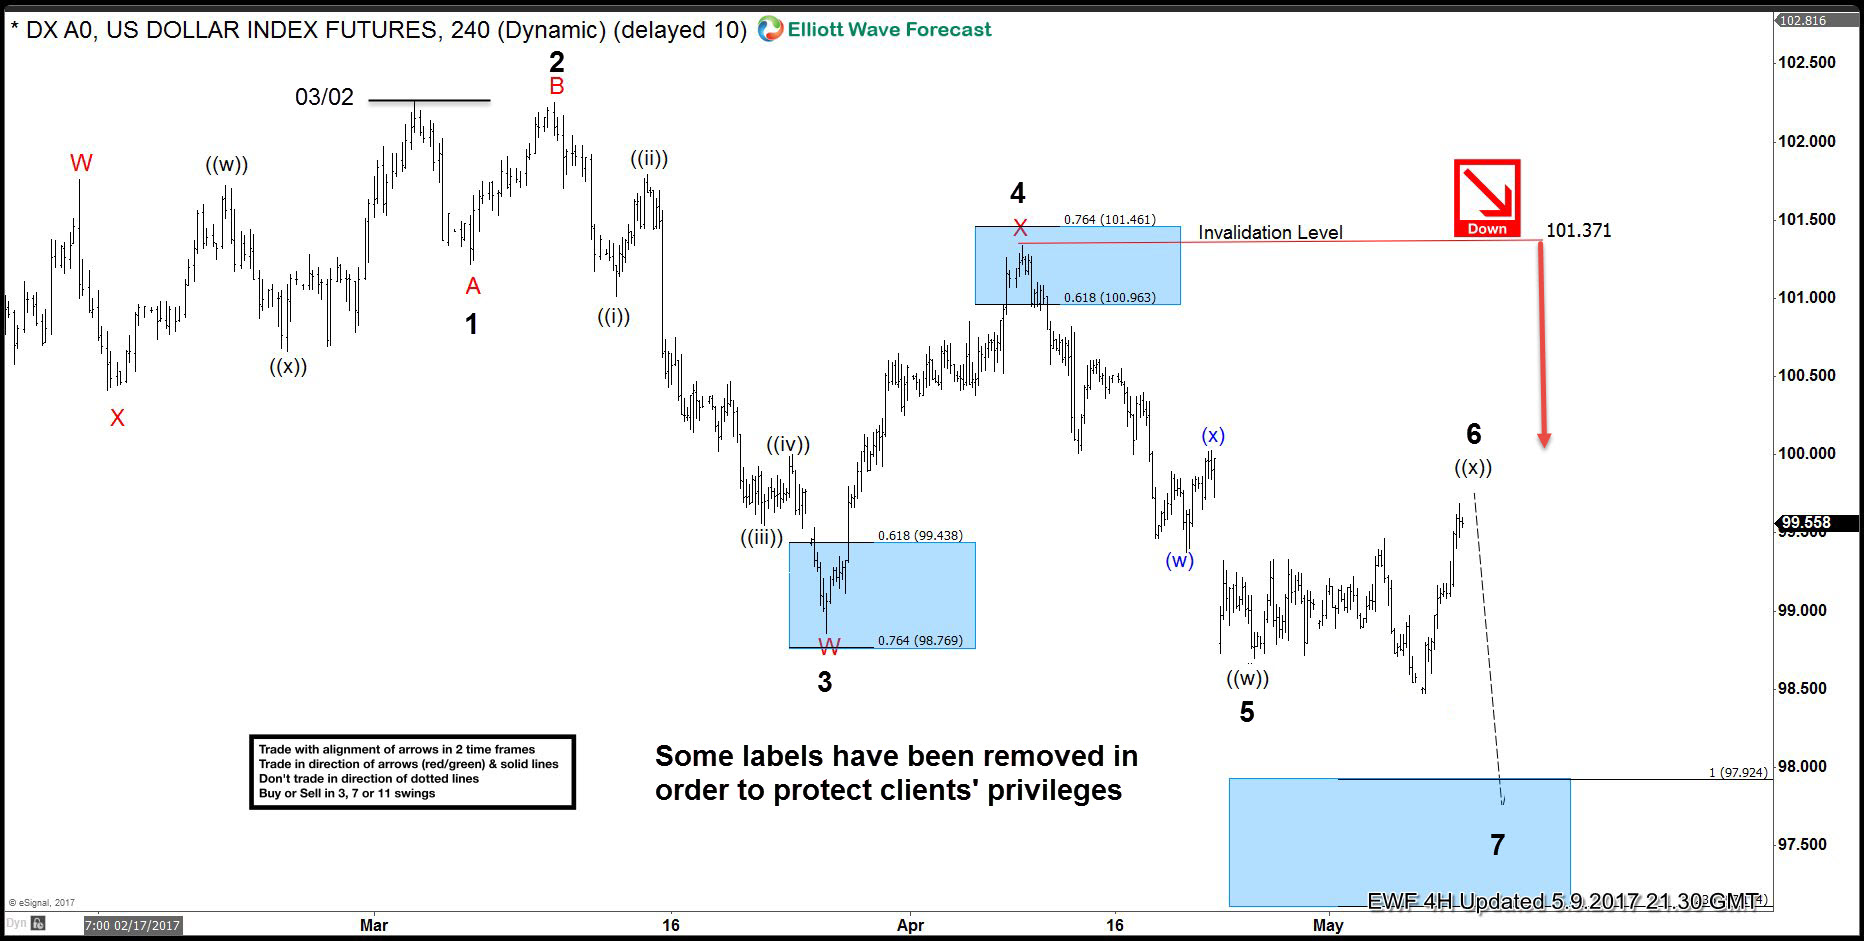
As our members know, we were pointing out that USDX is having incomplete bearish swings sequnces within the cycle from the 03/02 peak. From the chart below, we can see that USDX has a clear 5 swing from the peak, when we’re about to complete 6th swing as Irregular Flat. Consequently, we’re calling further weakness once proposed Flat is complete. Dollar index is targeting 97.92-96.91 area ideally.
Now let’s take a look at the short term structures…
USDX 1 Hour Asia Chart 05.11.2017
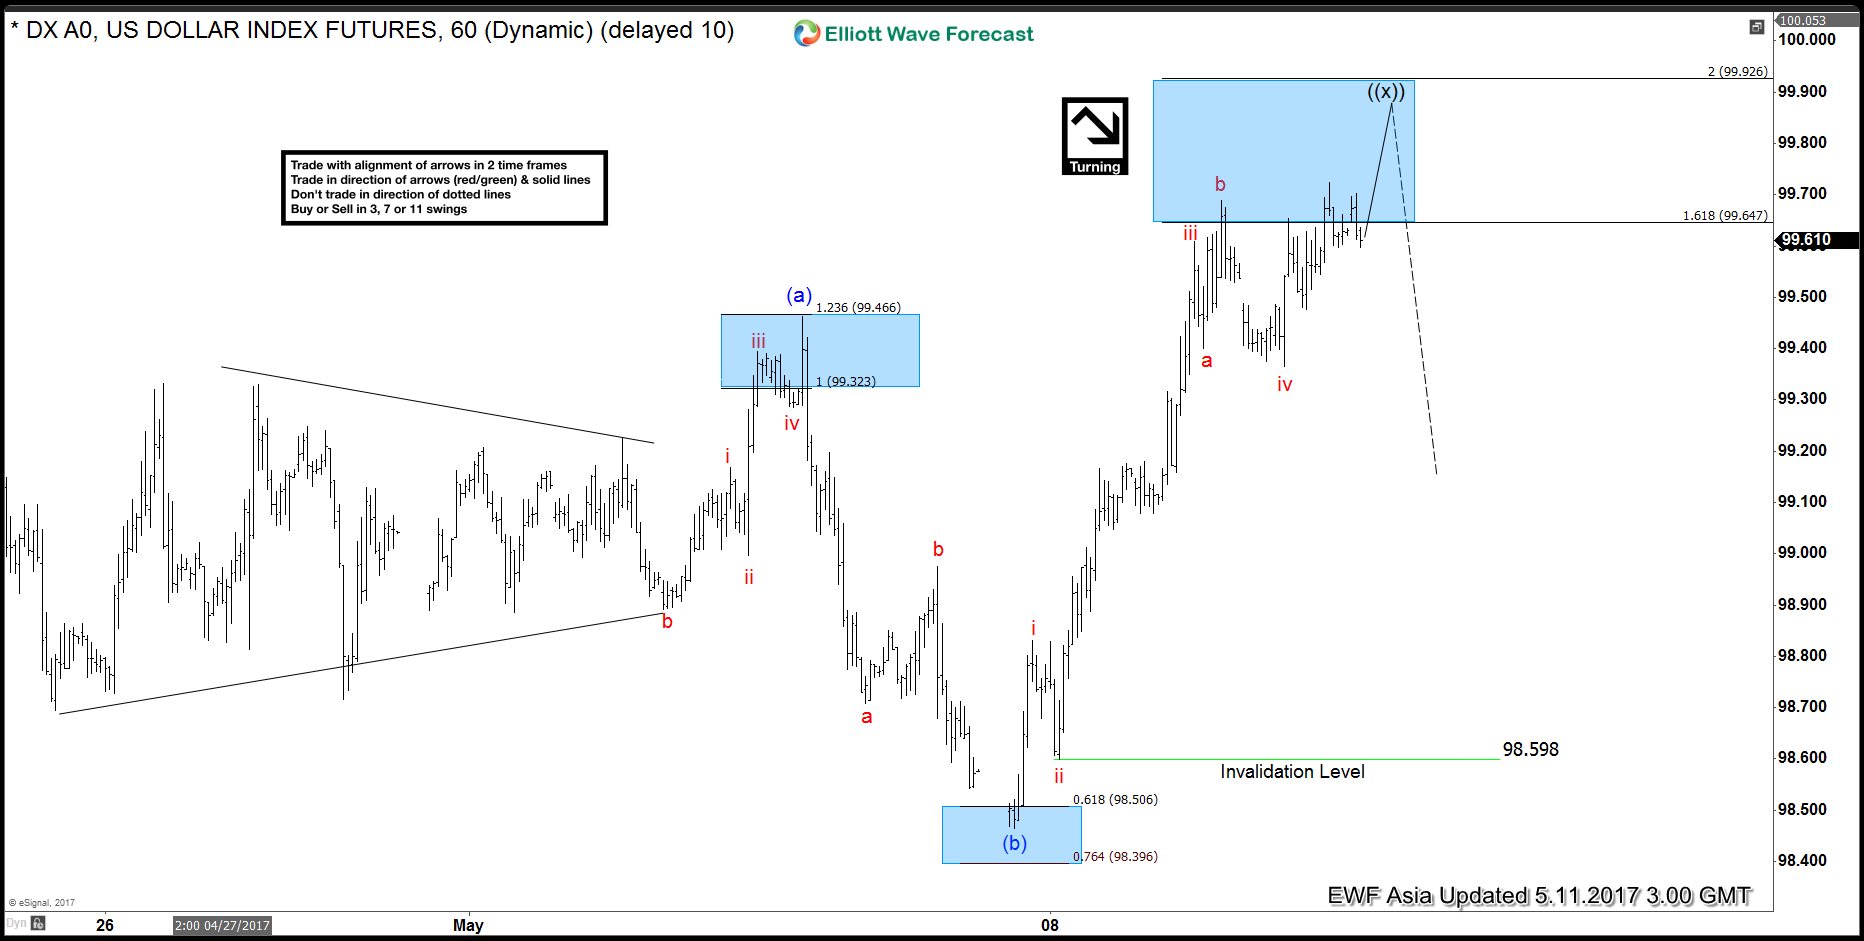
Dollar Index is about to complete wave ((x)) recovery as expanded flat structure. We got clear 5 waves from the lows that is part of wave (c) of flat. Although, the extreme area is reached at 99.64 -99.92, and we have minimum requirements for correction to complete soon, we see possibility of marginal extension higher within the blue box still.
USDX 1 Hour NY Midday Chart 05.11.2017
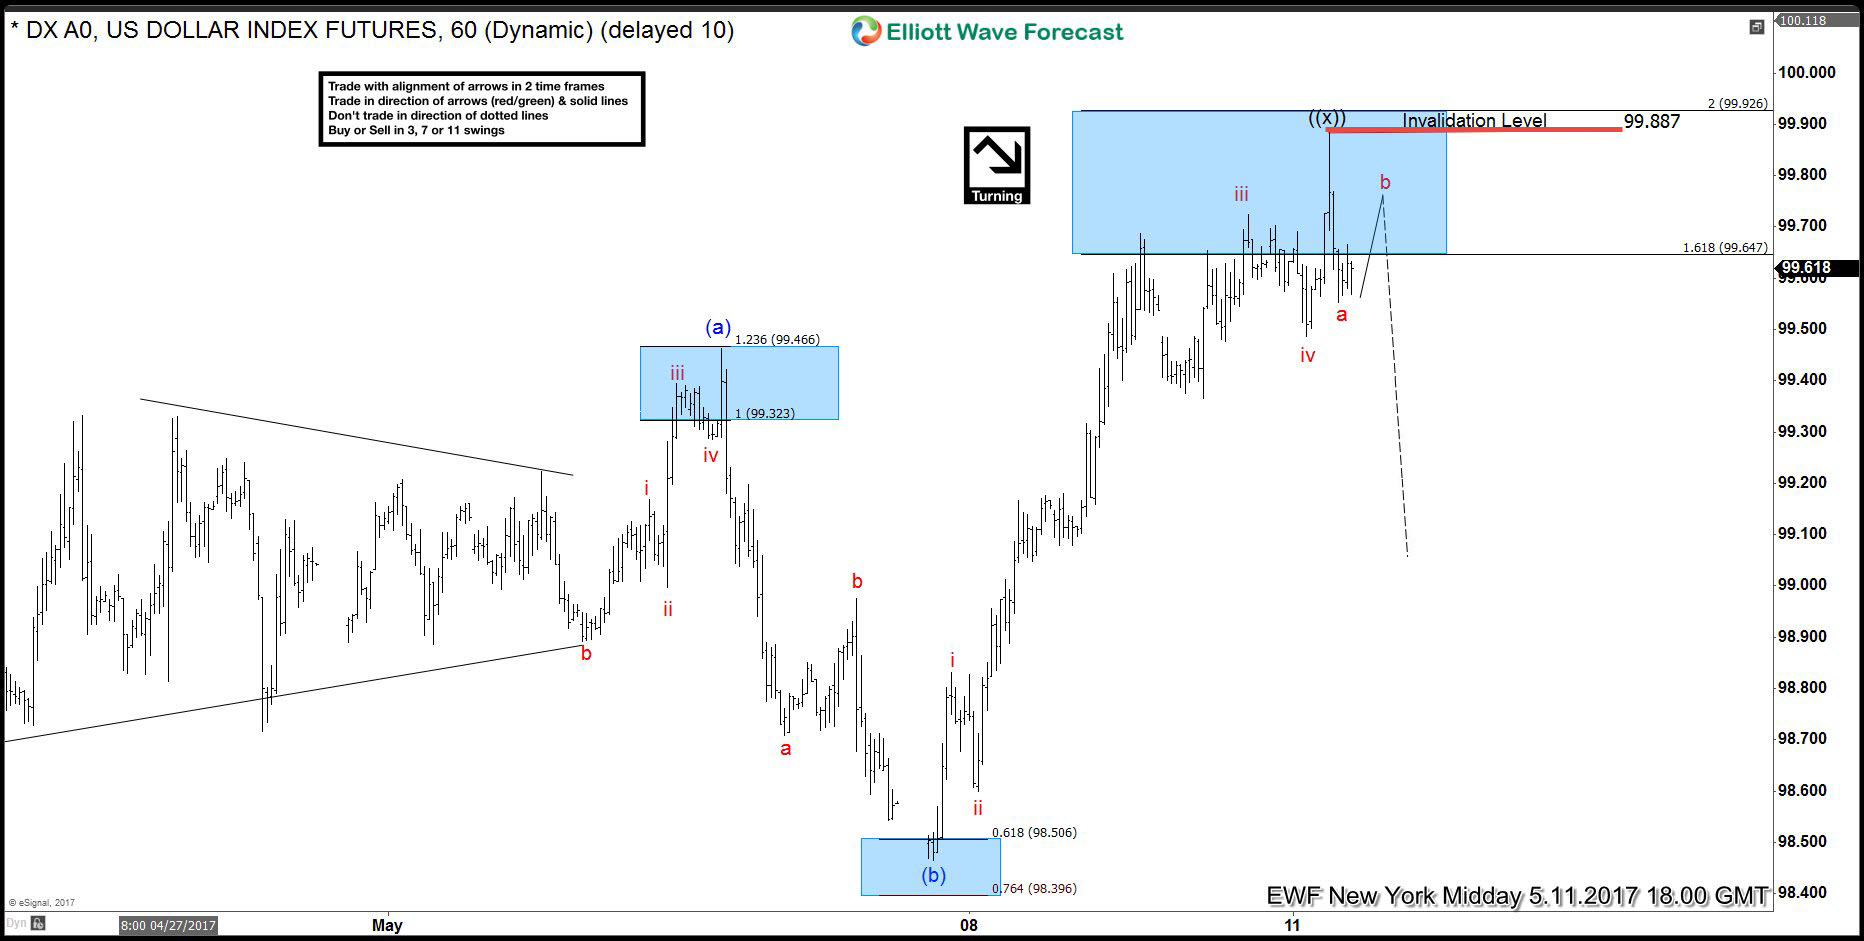
We got expected marginal extension and reaction from the blue box. Now we’re calling wave ((x)) recovery completed at 99.88 peak as expanded flat. While the price stays below 99.88 peak further weakness should ideally follow.
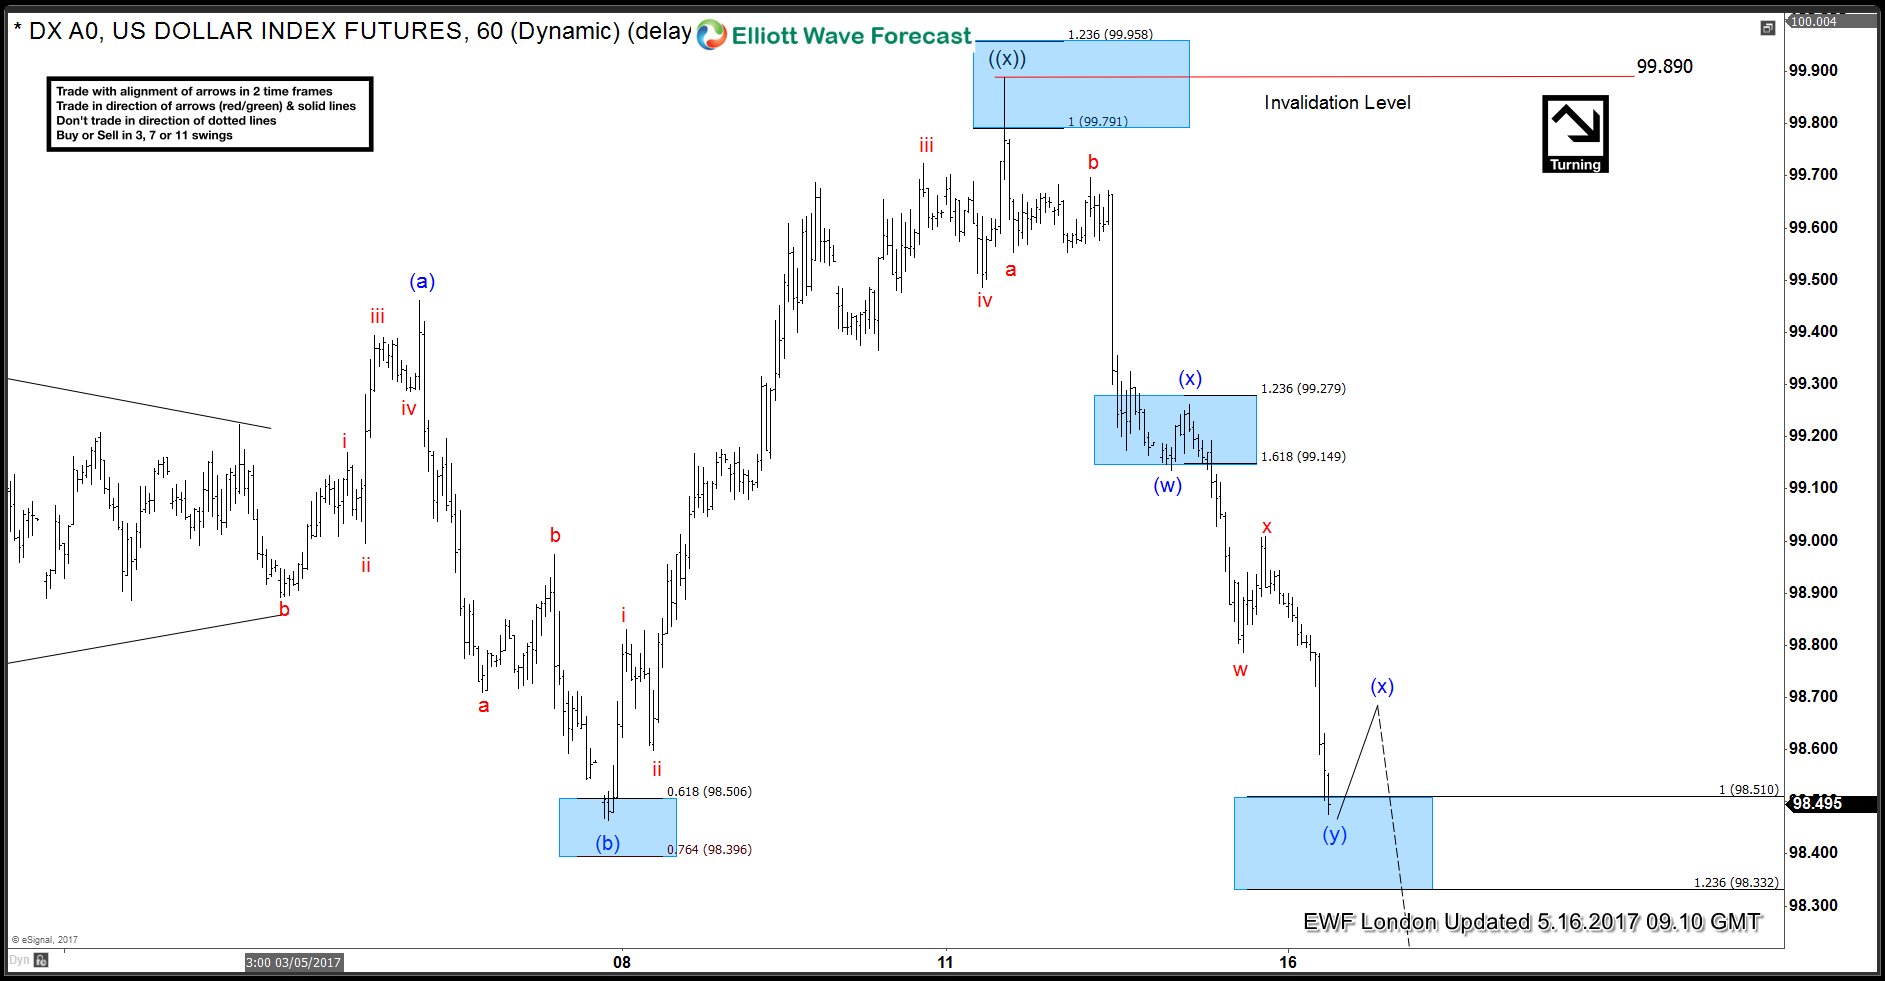
USDX 1 Hour London Chart 05.16.2017
99.88 peak held nicely and USDX is now breaking lower, suggesting more downside in 7th swing towards proposed 97.92-96.91 area.
Keep in mind market is dynamic. If you’re interested in the future path of USDX or any of the other 50+ instruments we cover, join us now. You can find Elliott Wave analysis in the membership area of EWF. If not a member yet, Sign Up for Free Trial now.
Elliott Wave Forecast
Through time we have developed a very respectable trading strategy. It defines Entry, Stop Loss and Take Profit levels with high accuracy and allows you to make position Risk Free, shortly after taking it, protecting your account. If you want to learn all about it and become a professional Trader, join us now for Free.
You will get access to Professional Elliott Wave analysis in 4 different time frames. 3 live Analysis Session done by our Expert Analysts every day. 24 Hour Chat Room support, Market Overview, Weekly technical videos and much more. Welcome to Elliott Wave Forecast.