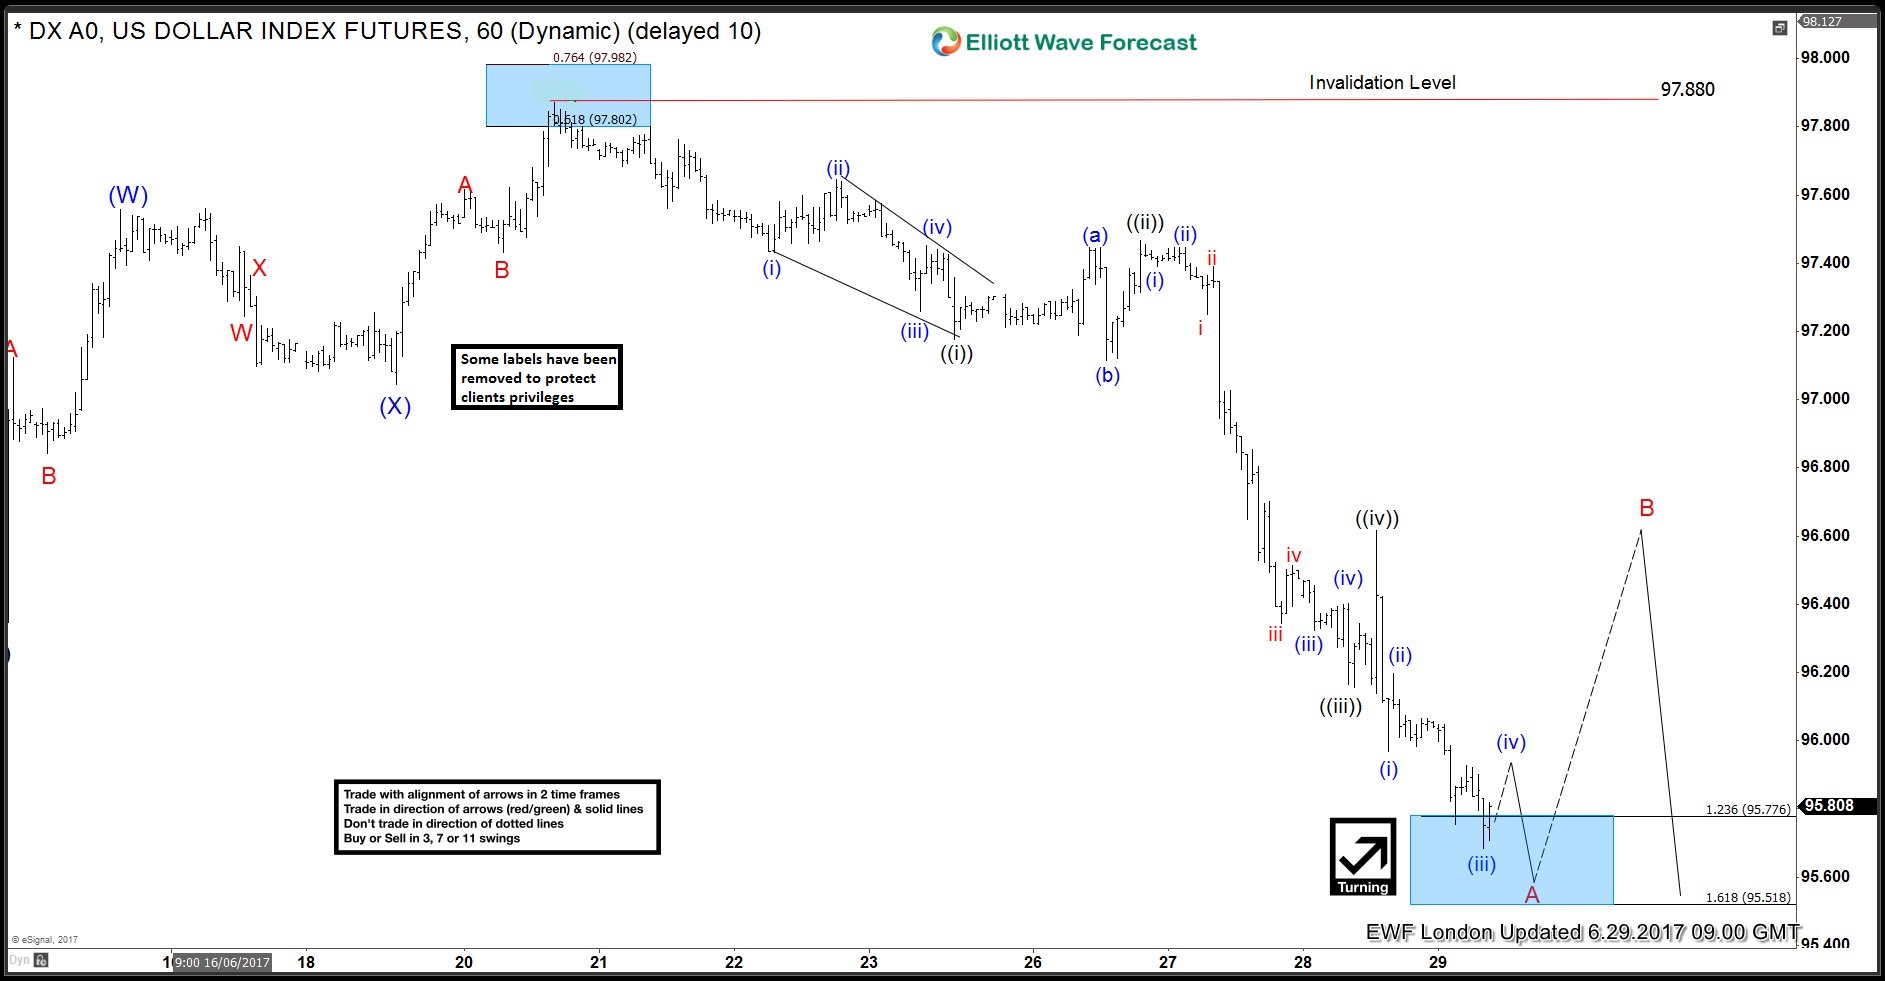
Short term Elliott wave view in USDX suggest that the cycle from 6/20 peak (97.88) is unfolding as an impulsive Elliott wave structure. This 5 wave move could be a wave A of an Elliott wave zigzag structure structure or a wave C of a FLAT correction. In either case, after 5 wave move ends, pair should pull back in 3 waves at least as the Elliott Wave Theory suggests. The Minute wave ((i)) ended at 97.16. Minute wave ((ii)) pullback ended at 97.46, Minute wave ((iii)) at 96.13 low, Minute wave ((iv)) pullback ended at yesterday’s peak 96.61. Below from there Minute wave ((v)) is in progress either in wave C or A, which already reached the minimum extension area in between inverse 1.236-1.618% extension area of previous wave ((iv)) at 96.02-95.83 area and also the 100% to 1.618% extension area of ((v))-((i)) target area at 95.86-95.51 area.
Which means cycle from 6/20 peak (97.88) is mature and pair can start the 3 waves bounce at any moment. However while below 96.61 peak another marginal push lower towards 95.51 area could be seen before ending the cycle. In case of further weakness in Minute wave ((v))) pair could see 0.618-0.764% fibonacci Extension area of wave ((i))+((iii)) at 95.55-95.29 area before ending the 5 waves impulse sequence from 6/20 peak. Afterwards, DXY should bounce in 3, 7 or 11 swings for the correction of 6/20 cycle before more downside is seen provided the pivot at 6/20 peak remains intact or If the bounce turns out to be stronger than expected and breaks the pivot at 6/20 peak (97.88) then that would suggest 5 wave move up from 97.88 low was part of a wave C of a FLAT from 6/14 (96.27) low and pair may resume higher.
USDX 1 Hour Elliott Wave Chart