


EURCAD Technical Analysis January 14/2019
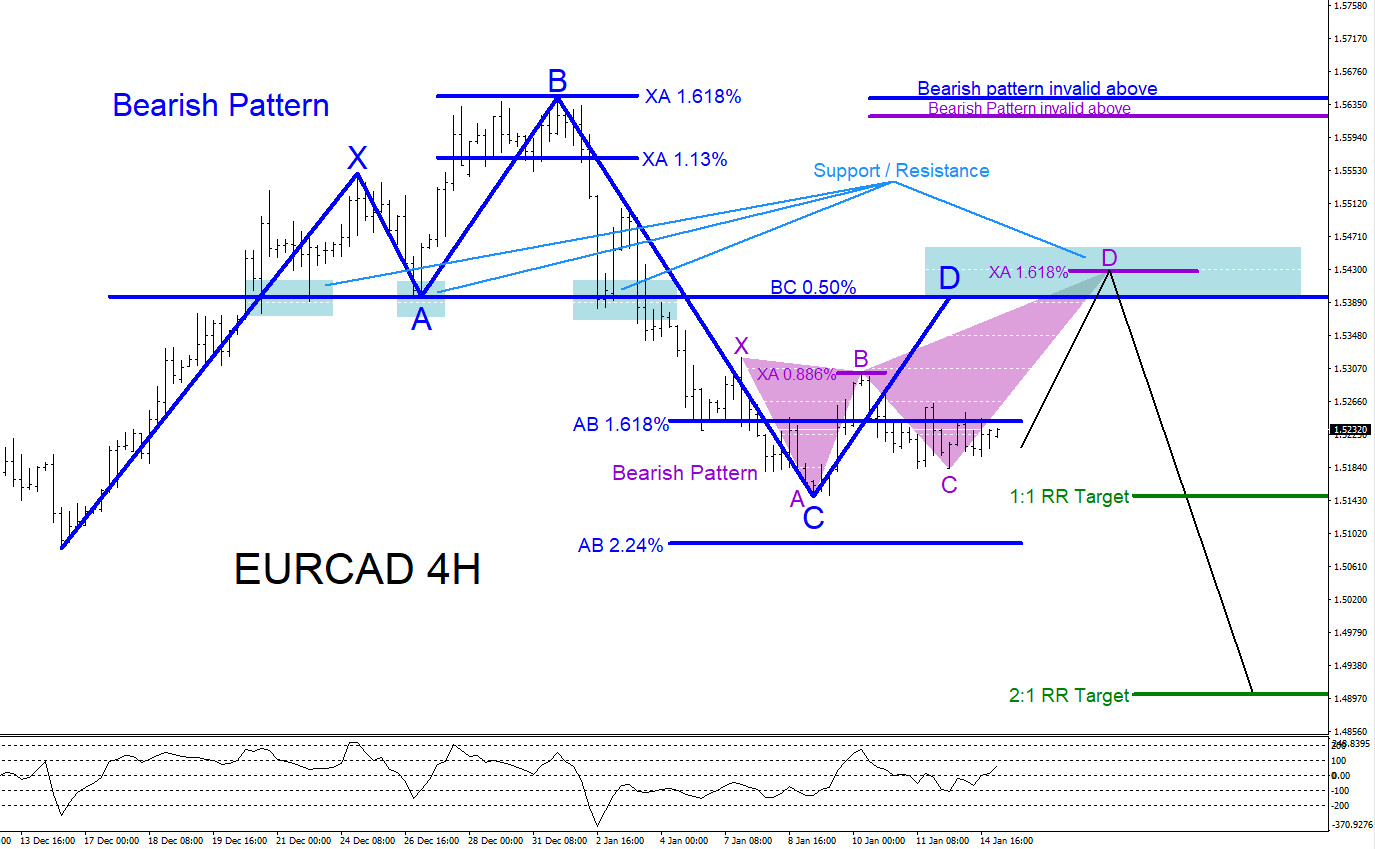
Bearish market patterns can be seen on the EURCAD 4 hour chart. In the chart below there are possible bearish patterns that can trigger SELLS if the market makes another move higher. The blue bearish pattern triggers SELLS at the BC 0.50% Fib. retracement level and the purple bearish pattern also trigger SELLS nearby at the XA 1.618% Fib. retracement level. Traders should watch these levels for a possible reaction lower because there has been previous support price action in the past at these levels. EURCAD showed strong support in the past at the blue BC 0.50% level which should now play as strong resistance if price can reach back up there. EURCAD can also rally a bit higher towards the purple XA 1.618% Fib. retracement level where the pair will encounter more selling pressure from traders reacting to the purple bearish pattern. Traders will need to wait and watch if the pair makes another push higher and also see how price reacts at the possible resistance zone (blue box) where EURCAD bears can be waiting to take back control. If looking to trade EURCAD stops should be placed at the point B high of the blue bullish pattern and traders should be patient and wait for price to make a move higher to the possible resistance zone (blue box) looking for a move lower to extend below the January 9/2019 lows which will hit the target levels (green). Waiting to SELL/SHORT at the minimum BC 0.50% Fib. retracement level (blue) will offer a better risk/reward trade setup. If price continues lower and breaks below the blue AB 2.24% Fib. retracement level before touching the minimum BC 0.50% Fib. retracement level then the sell trade setup is cancelled. Only time will tell what EURCAD will do but at least now you are aware of the possible area where the pair can reverse lower from.
EURCAD 4 Hour Chart 1.14.2019
Of course, like any strategy/technique, there will be times when the strategy/technique fails so proper money/risk management should always be used on every trade. Hope you enjoyed this article.
