Hello fellow traders. In this technical blog we’re going to see what Elliott Wave Flat structure looks like with real market example. We’re going to take a quick look at the past Elliott Wave chart of GBPAUD published in members area of www.elliottwave-forecast.com and explain the theory of Flat structure.
Elliott Wave Flat
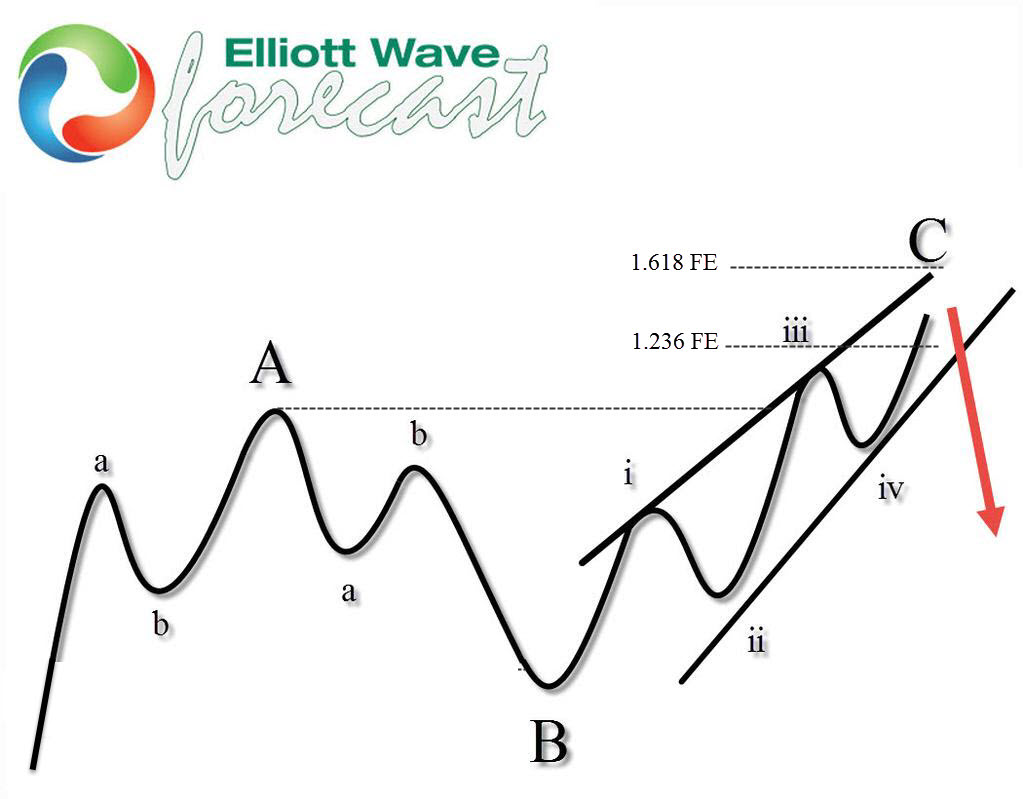
Elliott Wave Flat is a 3 waves corrective pattern which could often be seen in the market nowadays. Inner subdivision is labeled as A,B,C , with inner 3,3,5 structure. That means waves A and B have forms of corrective structures such as zigzag, flat, double three or triple three. Third wave C is always a 5 waves structure, either as motive impulse or ending diagonal pattern. In Regular Flats wave B is usually a deep pull back but it needs to complete above the starting point of wave A, and wave C ends above the ending point of wave A . Wave C completes usually close to 1.236 Fibonacci extension of A related to B, but sometimes it could go up to 1.618 fibs ext. At the graphic below, we can see Regular Flat structure
Now let’s take a look what Elliott Wave Flat looks like with real market example.
GBPAUD Elliott Wave 1 Hour Chart 08.03.2017
In the chart below we can see that X red recovery is unfolding as a 3 waves corrective structure, labeled as ((a)), ((b)), ((c)). We can see both waves ((a)) and ((b)) have corrective structures. Wave ((b)) was a deep correction, while wave ((c)) is extended and unfolding as 5 waves structure. We’re currently in wave (v) blue of ((c)) black that has already exceeded 1.236 fibonacci extension:1.6630. We expect X red correction to complete any moment as Flat pattern and turns lower toward new lows.
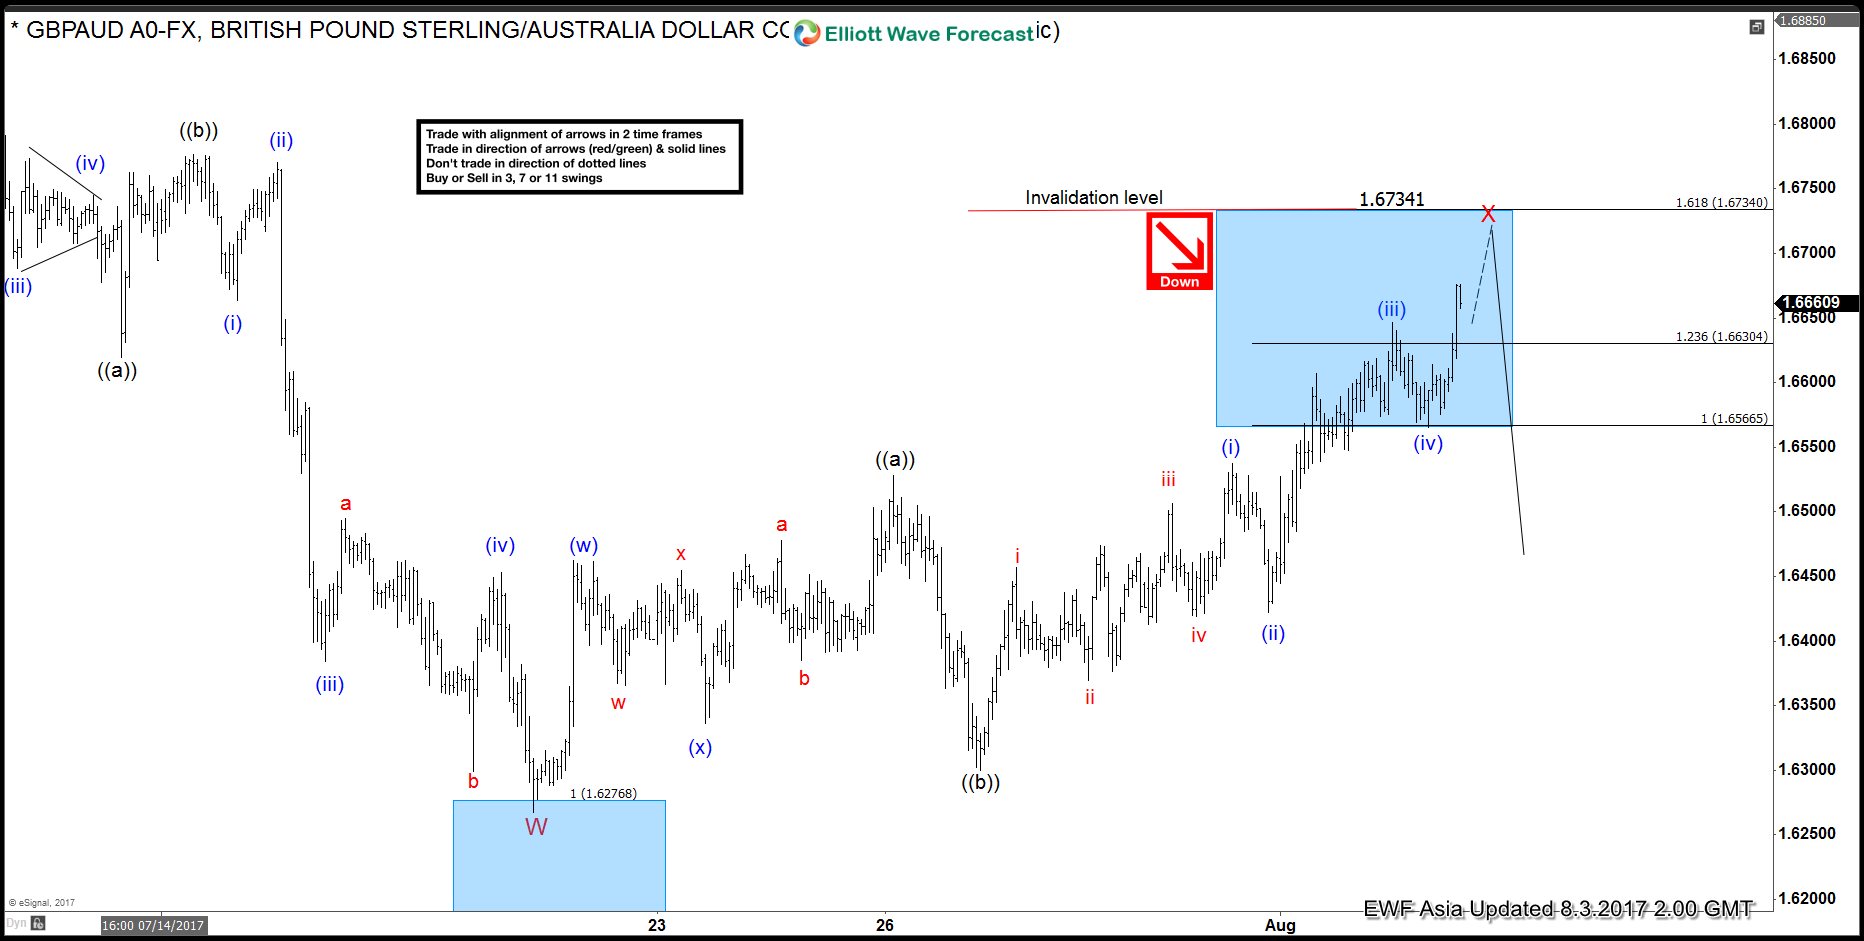
As our members know we were pointing out that GBPAUD has a bearish swings sequence from 05/09 peak. Consequently , we advised members to avoid buying it and keep selling the rallies in 3,7,11 swings. We sold the pair at 1.666 with initial target of 1.609. Trade Setup wave presented to members in 08/02 Live Trading Room.
Proper Elliott Wave counting is crucial in order to be a successful trader. If you want to learn more on how to implement Elliott Wave Theory in your trading and to learn more about next trading opportunities in the Market, try us free for 14 days. You will get access to Professional Elliott Wave analysis in 4 different time frames, Daily Elliott Wave Setup Videos ,Live Trading Room and 2 live Analysis Session done by our Expert Analysts every day, 24 hour chat room support, market overview, weekly technical videos and much more…
Welcome to Elliottwave-forecast.com !