
The global financial market boasts many opportunities for investors to make money. Several assets, such as foreign currencies, stocks, and ETFs, can be explored, and each offers its own unique potential for profit. However, investors need more than luck to make sound trading decisions. Here are the top five technical analysis tools available today.
The Different Types of Analysis

There are two primary approaches to evaluating investments: fundamental analysis and technical analysis. Both types of analysis aim to predict the future price movement of assets, but they take different approaches.
Fundamental analysis is used to assess the intrinsic value of an asset. It is based on the principle that the current price of a security does not reflect its worth. Fundamental analysis is typically employed by those who prefer to open long-term positions. As such, those involved in this type of analysis attempt to estimate the future value of an asset relative to its current value.
Conversely, technical analysis involves evaluating financial assets by reviewing historical price and volume information.
The Best Technical Analysis Tools
Technical analysis studies how supply and demand for a security influence changes in price, volume, and volatility. When combined with appropriate trading rules, a security's past trading activity and price changes can be valuable indicators of future price movements.
Technical analysis is often used to generate short-term trading signals. They can also help you better assess a security's strengths or weaknesses relative to the overall market or one of its sectors. This information allows analysts to improve their overall valuation assessments. Here are the best technical analysis tools for smarter online trading decisions:
Charting Tools
The main idea behind technical analysis is that an asset's price movement is not random. Asset prices tend to follow patterns that repeat over time. The historical price movement of an asset can be presented visually on a chart.
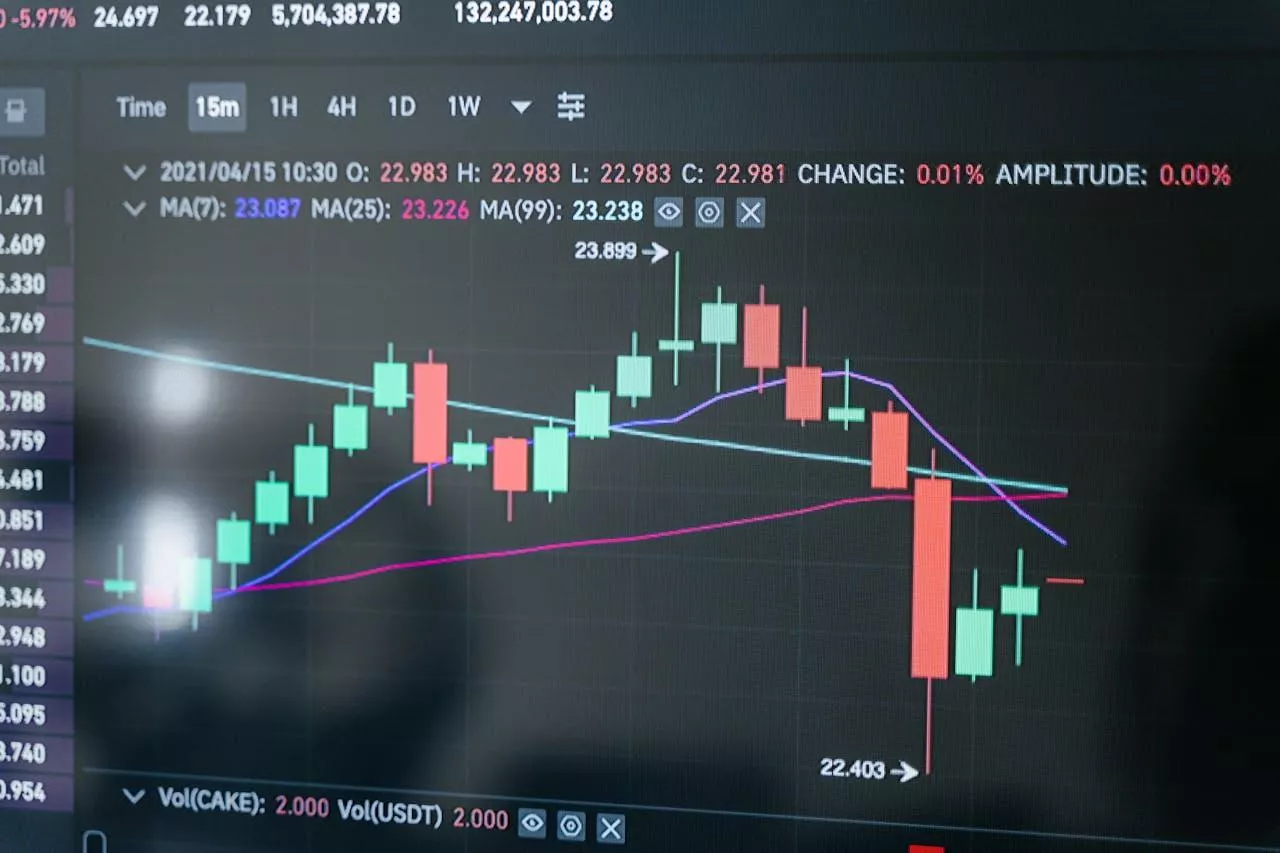
Most trading charts use Japanese candlesticks to track asset price movements. The most popular charting tool is TradingView, which most brokers integrate directly into users' trading interfaces. Advanced traders use MetaTrader due to its extensive trading features and expert advisors.
A candlestick has the opening, closing, high, and low prices. These candlesticks sometimes form patterns that make it easier for traders to predict the direction it's headed. A bullish pattern forms when the candlesticks are forming with upward momentum, while a bearish pattern builds if the candlesticks dip in a downward movement.
Bullish and bearish patterns are a few candlestick patterns that guide the trading world. To identify a trading opportunity, focus on understanding an asset's price direction and the pattern it forms in multiple time frames.
Moving Averages
Moving averages are trading indicators that provide information about the direction of a price trend. They work by averaging the price over a specific duration, helping to clarify the market direction. There are two types: the simple moving average (SMA) and the exponential moving average (EMA).
Simple Moving Average
This adds up the closing price for the last X period divided by Y. For a 10-period simple moving average on a 1-hour chart, add the closing prices for the previous 10 hours and divide that number by 10. The answer you arrive at is the average closing price over the last 10 hours.
Exponential Moving Average
The exponential moving average focuses on the most recent times. It places more weight on the most recent periods. For a 5-period exponential moving average on the 24-hour chart, the weight of consideration will be more on the third to fifth day. The first and second days will be of lesser value compared to the more recent days. This allows the output to go majorly based on how the market is moving in recent times.
SMA and EMA can present several trading opportunities based on the patterns you detect. For example, if you notice that each time the 50-day SMA crosses above a 200-day SMA, the asset price enters a bullish trend, you can set a long position the next time the pattern repeats.
Relative Strength Index
Relative Strength Index (RSI) is a technical indicator that measures a currency pair's strength based on upward versus downward movement over time.
It works by tracking current price gains and losses and comparing them to the recent price. With RSI, you can tell if price momentum is strengthening or weakening.
The RSI is an oscillator that ranges between 0 and 100. Readings above 50 indicate that prices generally rise, while those below 50 signify otherwise. As a trader looking to use RSI for better trading decisions, you should be familiar with the three primary areas. RSI between:
- 0 to 30 means the asset is oversold.
- 30 to 70 means the assets are either overbought or oversold.
- 70 to 100 indicate that the asset is overbought.
When it’s above 70, you can easily identify a selling opportunity and below 30, a buying chance. Note that in a bull market, the support zone is usually around 40 to 50, while resistance in a bear market is around 50 to 60.
Fibonacci Retracement
Fibonacci retracement levels are technical analysis tools used to spot support and resistance levels. They're unique in the sense that they make use of mathematical relationships to plot a chart. The ratios used include:
- 0%
- 23.6%
- 38.2%
- 61.8%
- 78.6%
- 100%
Place the tool on a trading chart by picking two extreme points within a price range. Usually, this would be the peak and the trough. In an upward trend, the 100% mark is the low point, and vice versa in a downward trend. Common retracement levels traders watch for price reversals are 38.2%, 50%, and 61.8%. Price retracement to the 38.2% range may suggest a buying opportunity with a profit target at the 61.8% zone.
Bollinger Bands

Bollinger Bands are technical indicators that visualize overbought and oversold zones on the trading chart. The bands consist of three lines: upper, middle, and lower bands. The middle line is usually a Simple Moving Average (SMA) set to a period of 20 days, while the upper and lower bands are two standard deviations away from the SMA.
The wider the gap between the bands, the higher the price volatility; the tighter the gap, the lower the price volatility. If the price touches the upper band, it indicates the market is overbought. And if the price reaches the lower band, it suggests the market is oversold. Combined with other technical indicators like the RSI, Bollinger Bands are helpful in determining current market conditions and identifying profitable trading opportunities.
Essential Technical Analysis Tools To Succeed
Your goal as a trader is to profit from price changes in financial assets. Technical analysis tools are your go-to resources to help you understand the market and identify money-making opportunities. While this is not an exhaustive list of technical analysis tools, it features the most commonly used by traders. The most relevant technical analysis tools you need to become familiar with for trading success include charting tools, RSI, Bollinger Bands, Moving Averages, and Fibonacci Retracements.


Comments
Log in or sign up to join the conversation.