


Summary
- Tanger announced its 28th annual consecutive dividend increase and also is being shown the door by the S&P.
- With regard to the High-Yield Index, Steve Tanger, CEO at Tanger, said that “the market will take care of itself."
- If you're reading this article and are enthusiastic with regard to high-yielding mall REITs, be thankful that Tanger provided us with the news early.
Tanger Factory Outlet Centers (SKT) announced a penny-per-share dividend increase earlier this week.
It simultaneously released its Q4 2019 and year-end earnings earlier than expected, bumping up the date for that latter notification for a specific reason - to counteract the news that the S&P is dropping it from its High-Yield Dividend Aristocrats Index.
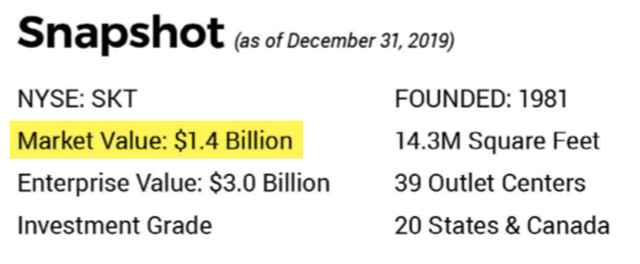
Source: SKT Investor Presentation
To be included in that particular index, a company must:
- Have a market cap of $1.5 billion or greater
- Increase dividends for 25 years in a row.
And, as you can see in the screenshot above, Tanger no longer meets requirement 1 after several sales last year - even though it will officially be doling out its 28th annual consecutive dividend increase.
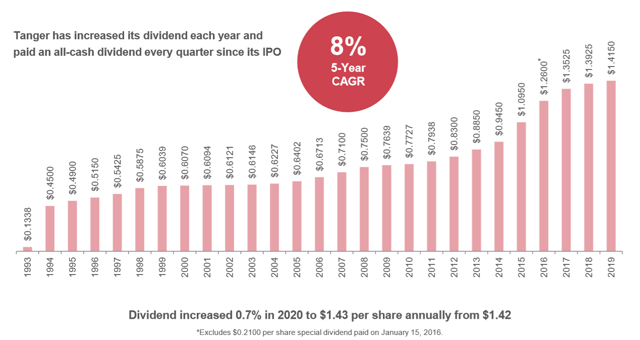
(Source: SKT Investor Presentation)
With regard to the High-Yield Index situation, CEO Steve Tanger says "The market will take care of itself."
He truly doesn't seem spooked by the situation. The reason he and his team announced the results early was simply to make sure they weren't overshadowed by the news.
(Incidentally, Feb. 3 is the official date Tanger will be moved from the index.)
Besides the dividend increase news, there's a lot more we learned from the earnings results and subsequent call. And not just for Tanger, but for mall REITs in general.
It's important to recognize the potential impact on them. So, here's a list of the earnings dates for the other entries:
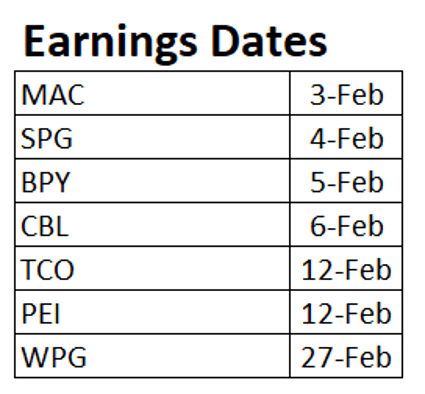
(Source: iREIT)
Let's Start with the Earnings Results
Tanger did post better-than-expected Q4 earnings results. Funds from operations (FFO) was $0.59 per share, for instance, and adjusted funds from operations (AFFO) was $0.64 per share.
Full-year results also were solid:
- Net income was $0.93 per share, compared to $0.45 for the prior year.
- FFO was $2.27 per share, compared to $2.48 for the prior year (including an $0.11-per-share dilutive impact related to the asset sales).
- AFFO was $2.31 per share, as compared to $2.48 (including an $0.11-per-share dilutive impact related to the asset sales).
Other key portfolio points included how:
- The consolidated portfolio occupancy rate was 97% at year's end compared to 96.8% on Dec. 31, 2018.
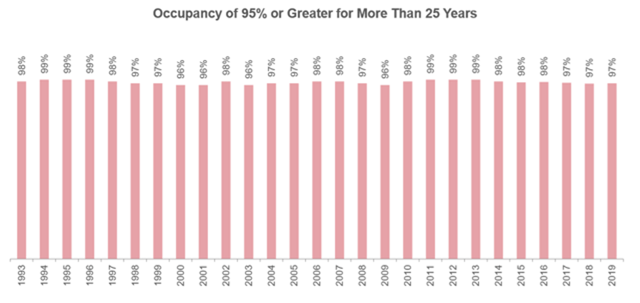
(Source: SKT Investor Presentation)
Continue reading on Seeking Alpha.
