


In this technical blog, we will look at the past performance of 1 hour Elliott Wave Charts of NVDA. In which, the decline from 29 March 2022 high unfolded as an impulse sequence and showed a lower low sequence in a higher time frame charts. Therefore, we knew that the structure in NVDA is incomplete to the downside & should see more weakness. So, we advised members not to buy the stock & sell the bounces in 3, 7, or 11 swings at the blue box areas. We will explain the structure & forecast below:
NVDA 1 Hour Elliott Wave Chart
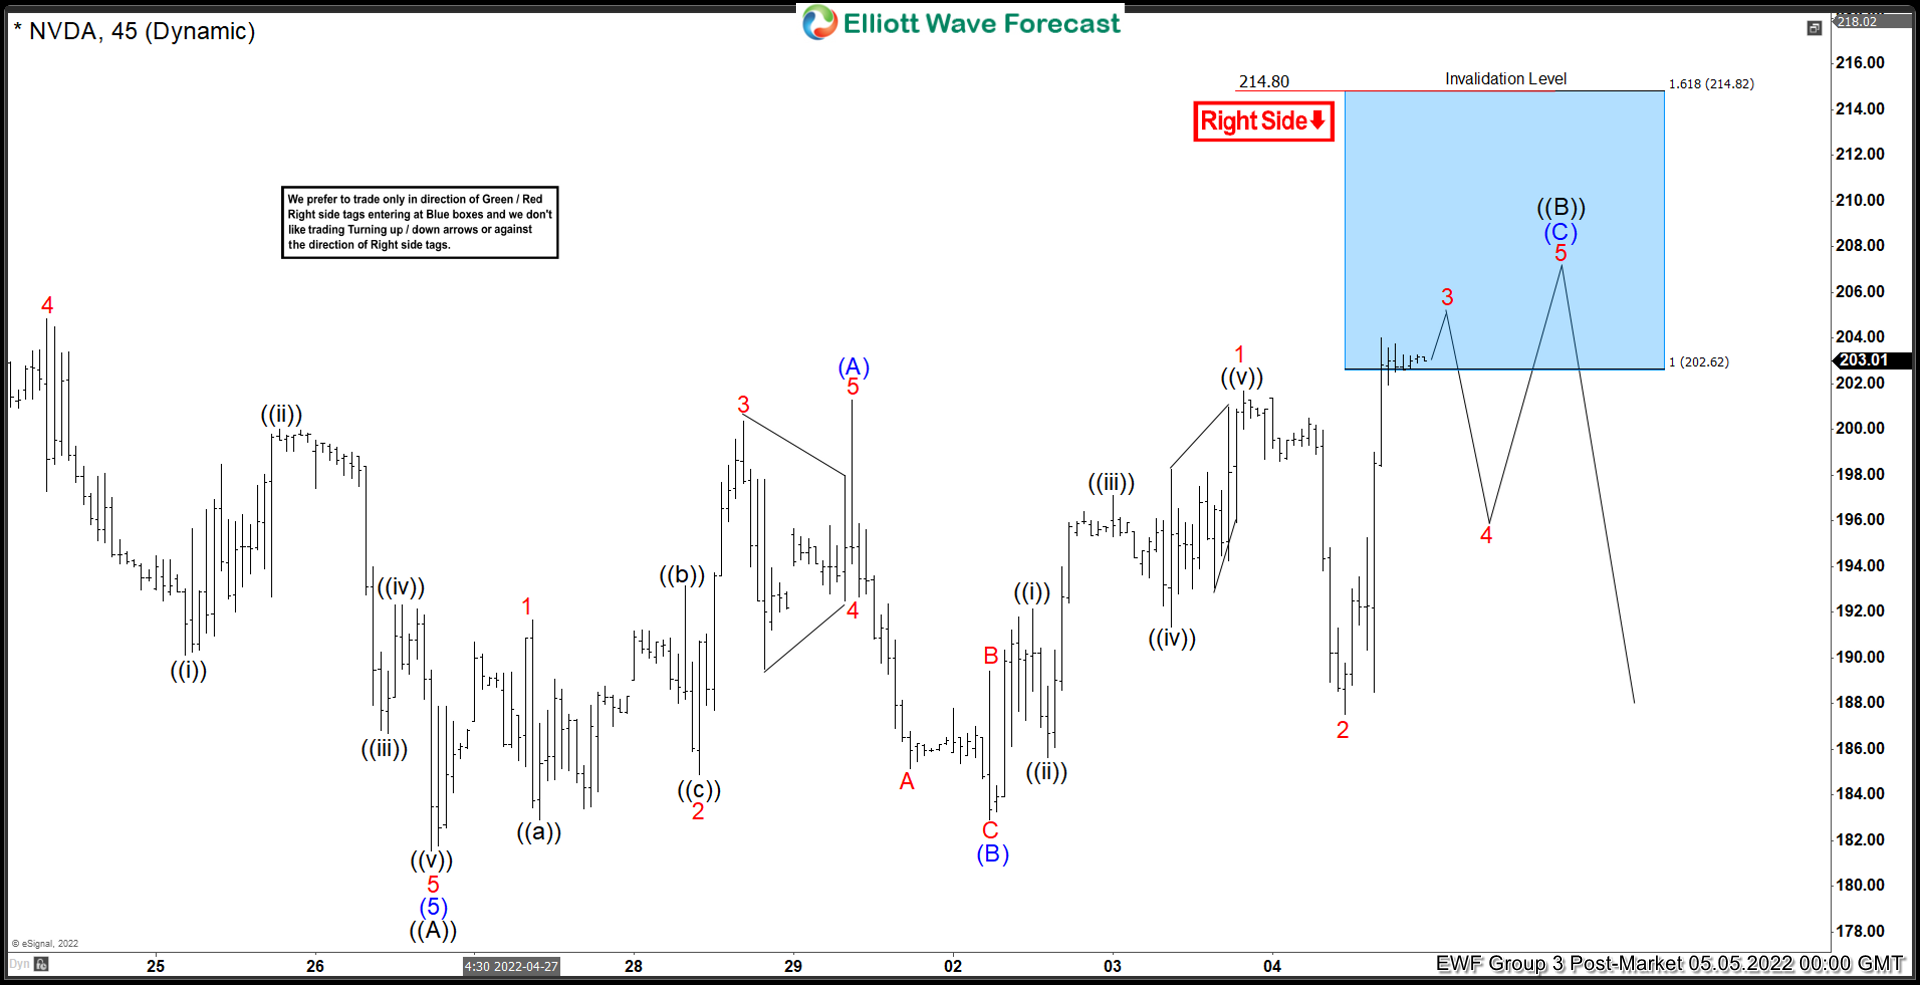
Here’s 1hr Elliott wave Chart from the 5/05/2022 Post-Market update. In which, the decline to $181.56 low ended 5 waves from 3/29/2022 high in wave ((A)) & made a bounce in wave ((B)). The internals of that bounce unfolded as an Elliott wave zigzag correction where wave (A) ended at $201.28 high. Then a pullback to $182.93 low ended wave (B) pullback and started the (C) leg higher towards $202.62- $214.82 blue box area from where sellers were expected to appear.
NVDA 1 Hour Elliott Wave Chart
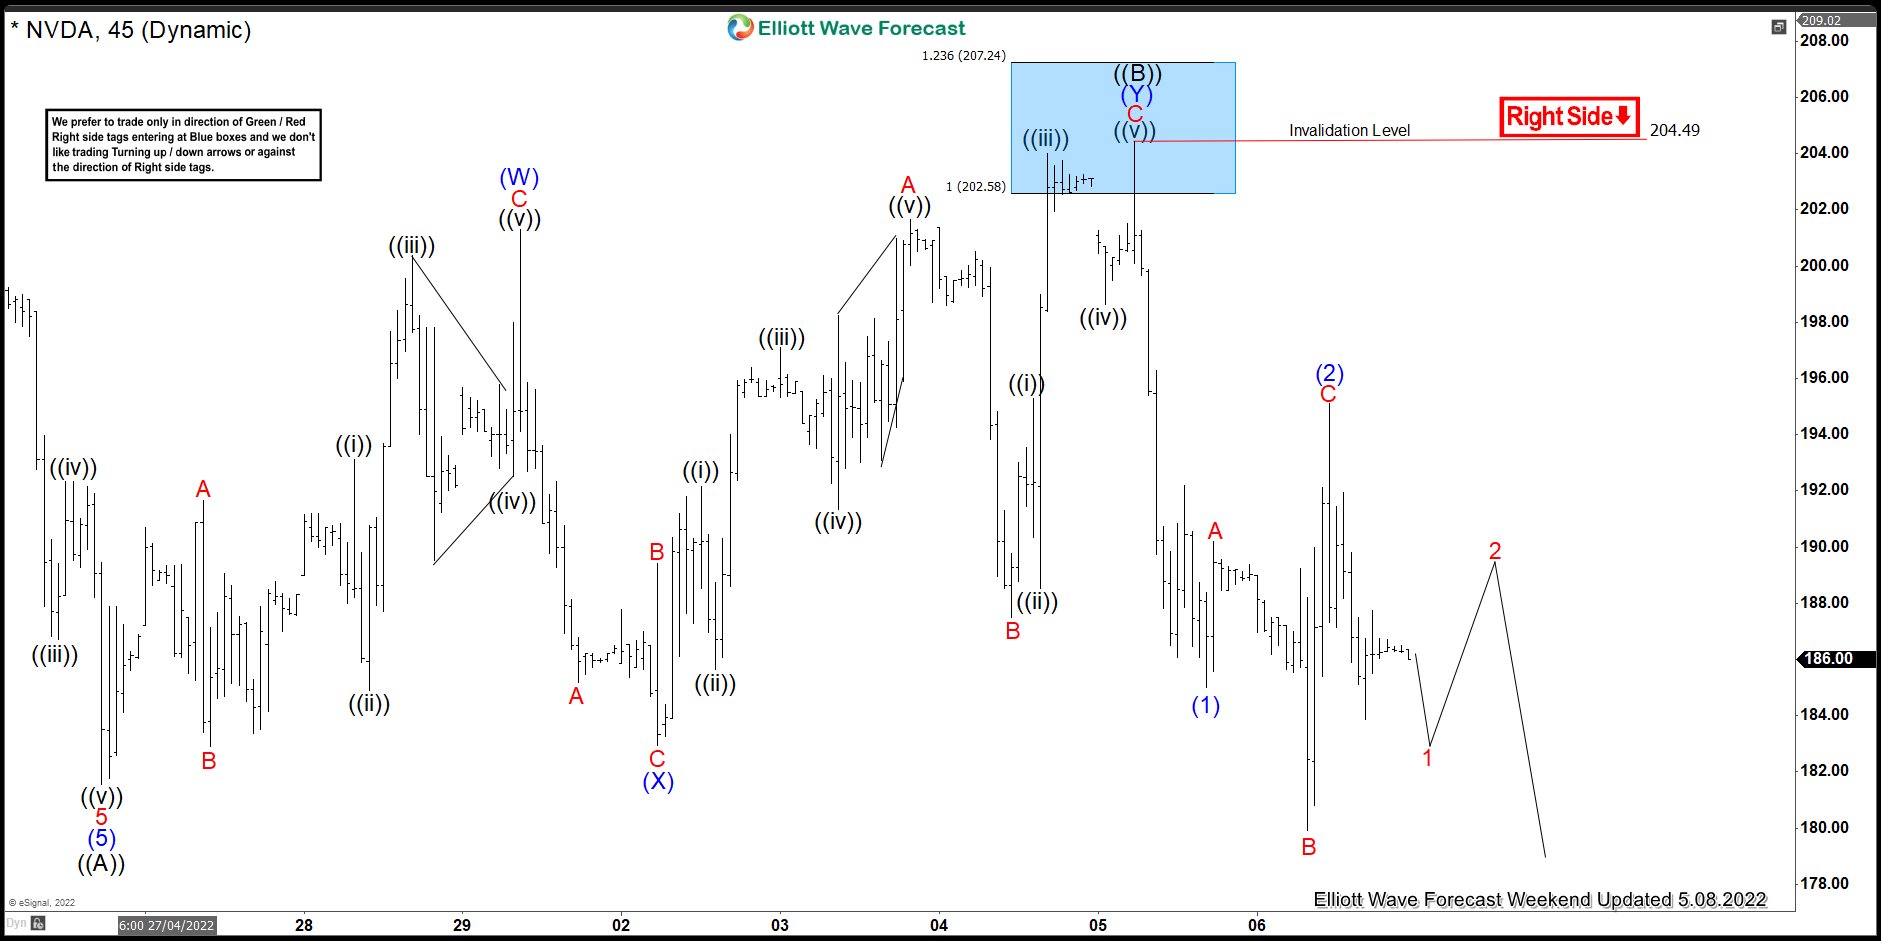
This is the 1hr view from the 5/08/2022 Weekend update. In which the stock is showing a reaction lower taking place from the blue box area allowing shorts to get into a risk-free position shortly after taking the position. Since then, the stock managed to see a break below $181.56 low confirming the next extension lower. However, it's important to note that with further data we were able to adjust the structure of the bounce to a double three structure.
Source: https://elliottwave-forecast.com/stock-market/nvda-elliott-wave-selling-extreme-blue-box-area/
