


ARM Holdings plc, a new public player with a deep innovation track record, leads in energy-efficient, high-performance processor design. It powers billions of devices and anchors the AI and mobile computing surge. The company’s scalable licensing model ensures recurring revenue across diverse sectors. Its robust ecosystem fosters long-term client relationships, securing ARM’s future in tech.
Trading above key moving averages with bullish breakouts and strong volume, $ARM signals continued institutional interest and trend strength. Following a strong rally on $ARM, we’re updating the charts to reflect its bullish momentum and technical structure.
ARM Daily Chart July 2025
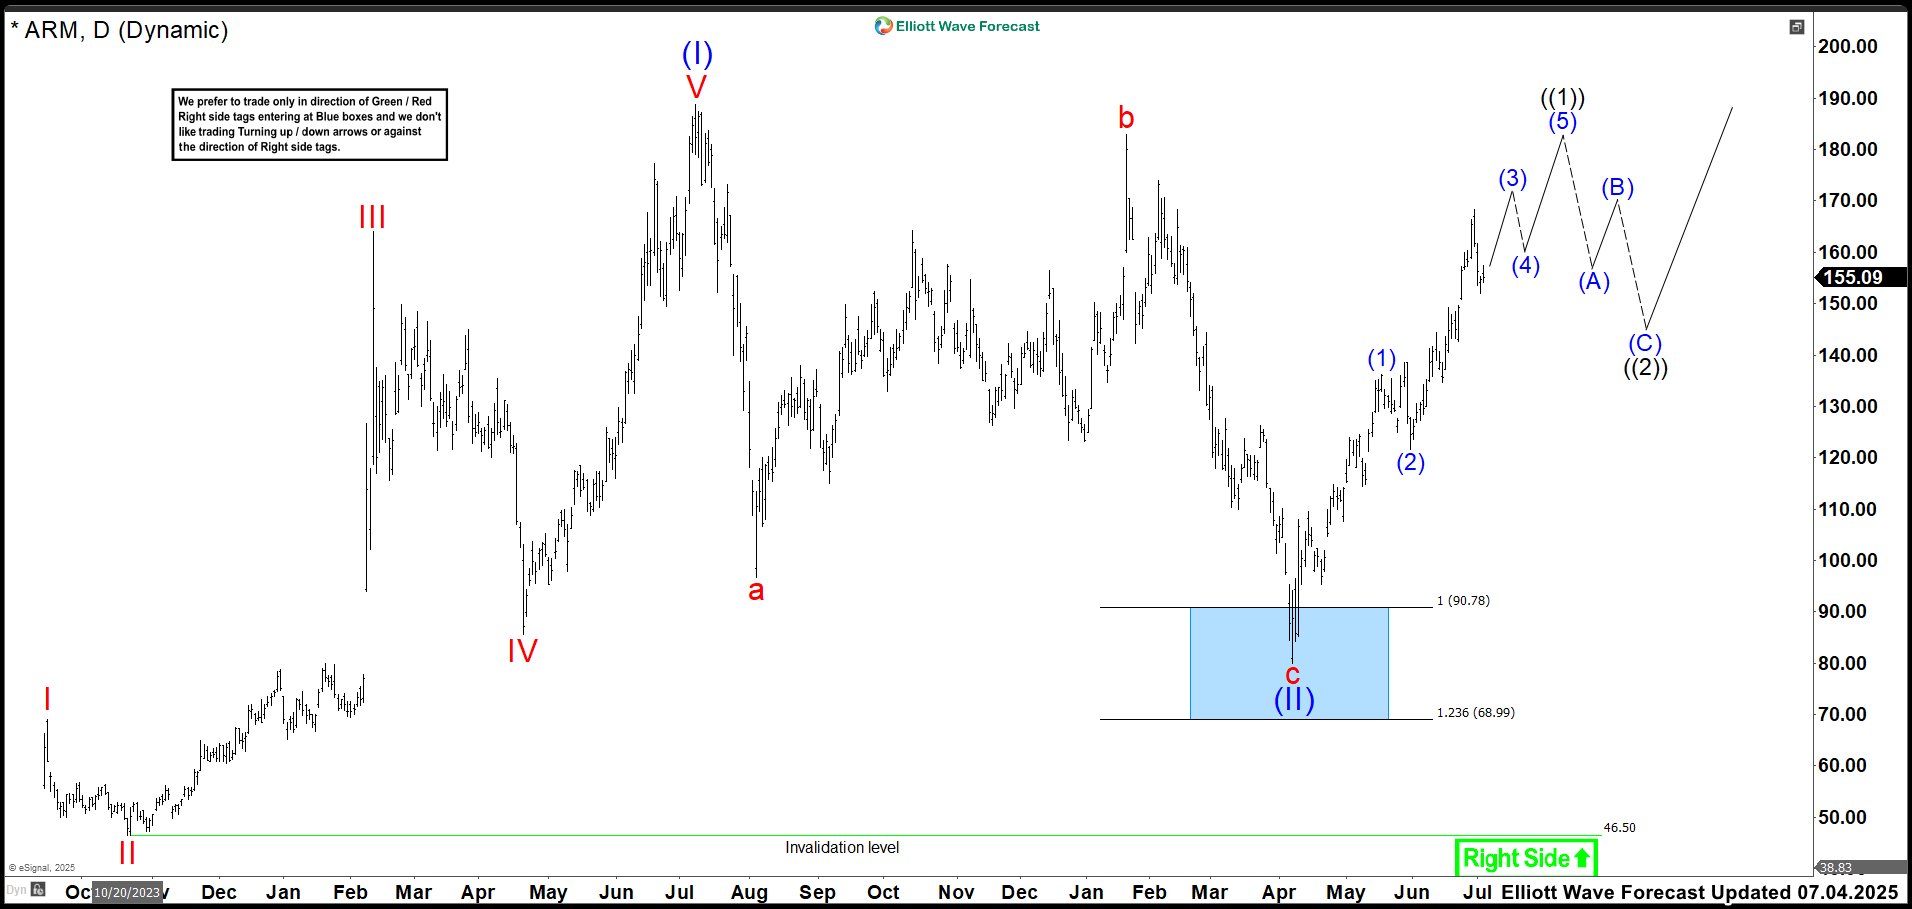
On the daily chart, ARM Holdings sparked a strong impulsive rally, completing wave (I) at the 188.75 high. Then it entered a flat correction as wave (II), pulling back into the 90.78–68.99 Blue Box — a high-probability reversal zone. The correction ended at the 80.00 low, igniting a sharp bullish reaction. That move initiated wave ((1)), which continues to unfold with strength. Currently, the structure is trading in wave 4 of (3) and it is looking for a rally as wave 5 of (3). After wave ((1)) completes, a pullback in wave ((2)) should follow. This next leg will likely develop in 3, 7, or 11 swings. Once complete, the broader bullish trend is expected to resume. Traders should watch the pullback for long setups.
ARM Daily Alternative Chart July 2025
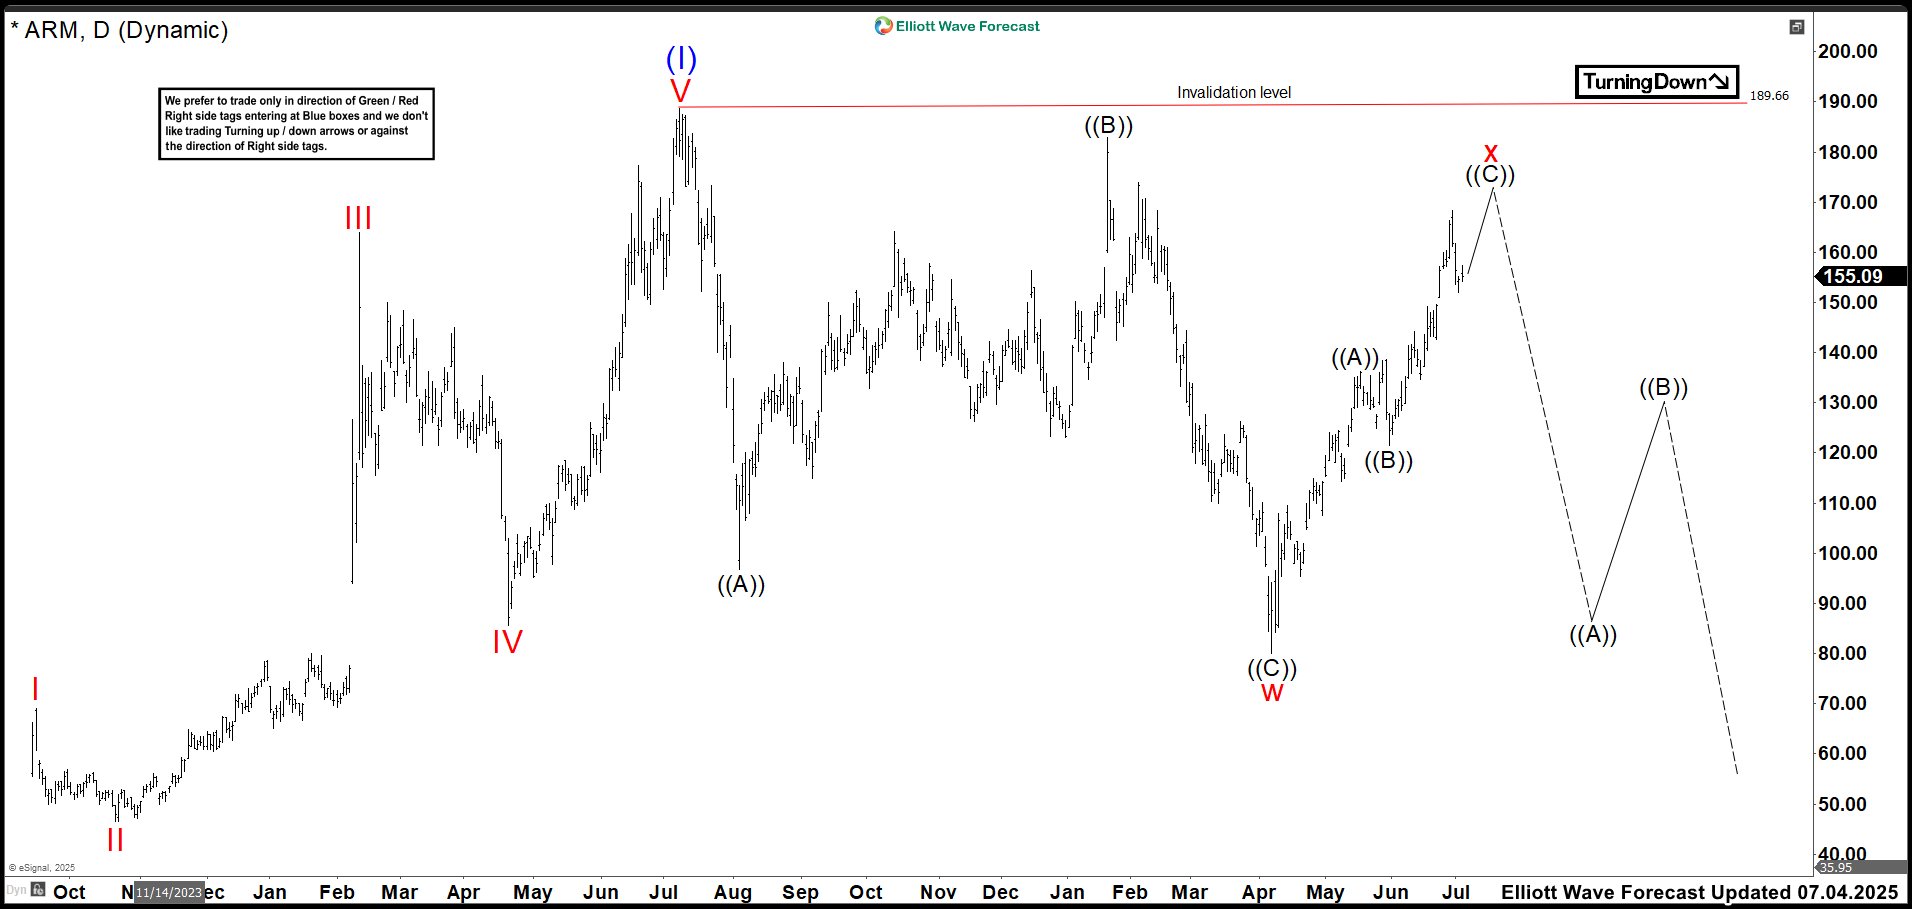
Although the Blue Box bounce supports the bullish case, an alternate view suggests wave (II) may still be incomplete. In this path, the 80.00 low may be wave w of a double correction. The current advance likely forms wave x as a zig zag and may need one more high to finish. If so, wave y could drive price below 80.00 to complete wave (II) and offer a buying opportunity. A break above 188.75 would invalidate this view and confirm the bullish continuation. Until then, stay flexible and track the structure in real time.
Source: https://elliottwave-forecast.com/stock-market/arm-surges-higher-updating-charts/
