


The VanEck Junior Gold Miners ETF (GDXJ), launched in 2009, focuses on small- and mid-cap gold and silver mining companies, primarily those generating most of their revenue from mining or related activities. Popular among investors chasing high-risk, high-reward opportunities in precious metals, the ETF offers targeted exposure. Below, we explore its Elliott Wave outlook.
GDXJ Monthly Elliott Wave View
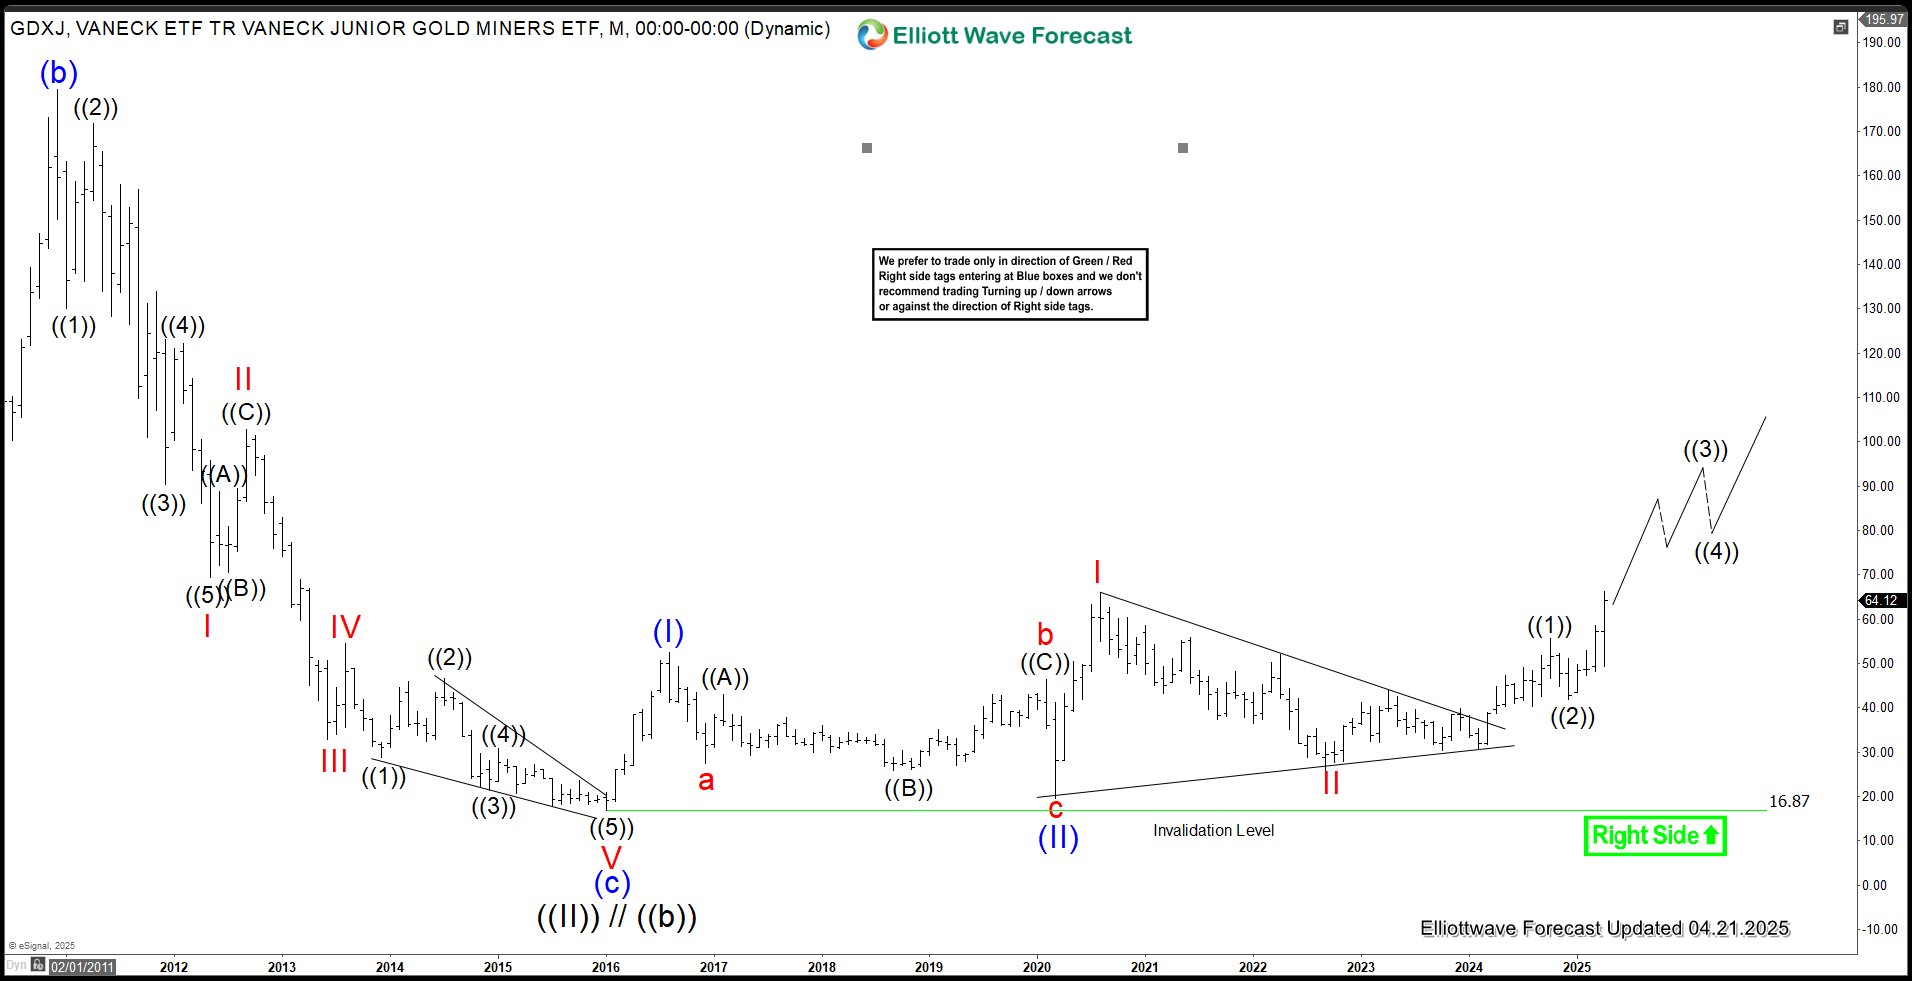
The monthly Elliott Wave chart for GDXJ (Junior Gold Miners ETF) indicates a significant low of $16.87 in 2016, marked as wave ((II)). From this bottom, the ETF began a strong upward trend. The first major peak, wave (I), reached $52.50, followed by a dip to $19.52 in wave (II). The ETF then climbed again, hitting $65.95 in wave I, with a subsequent pullback to $25.80 in wave II. As long as the ETF stays above $16.87, it’s likely to continue rising in the near term.
GDXJ Daily Elliott Wave View
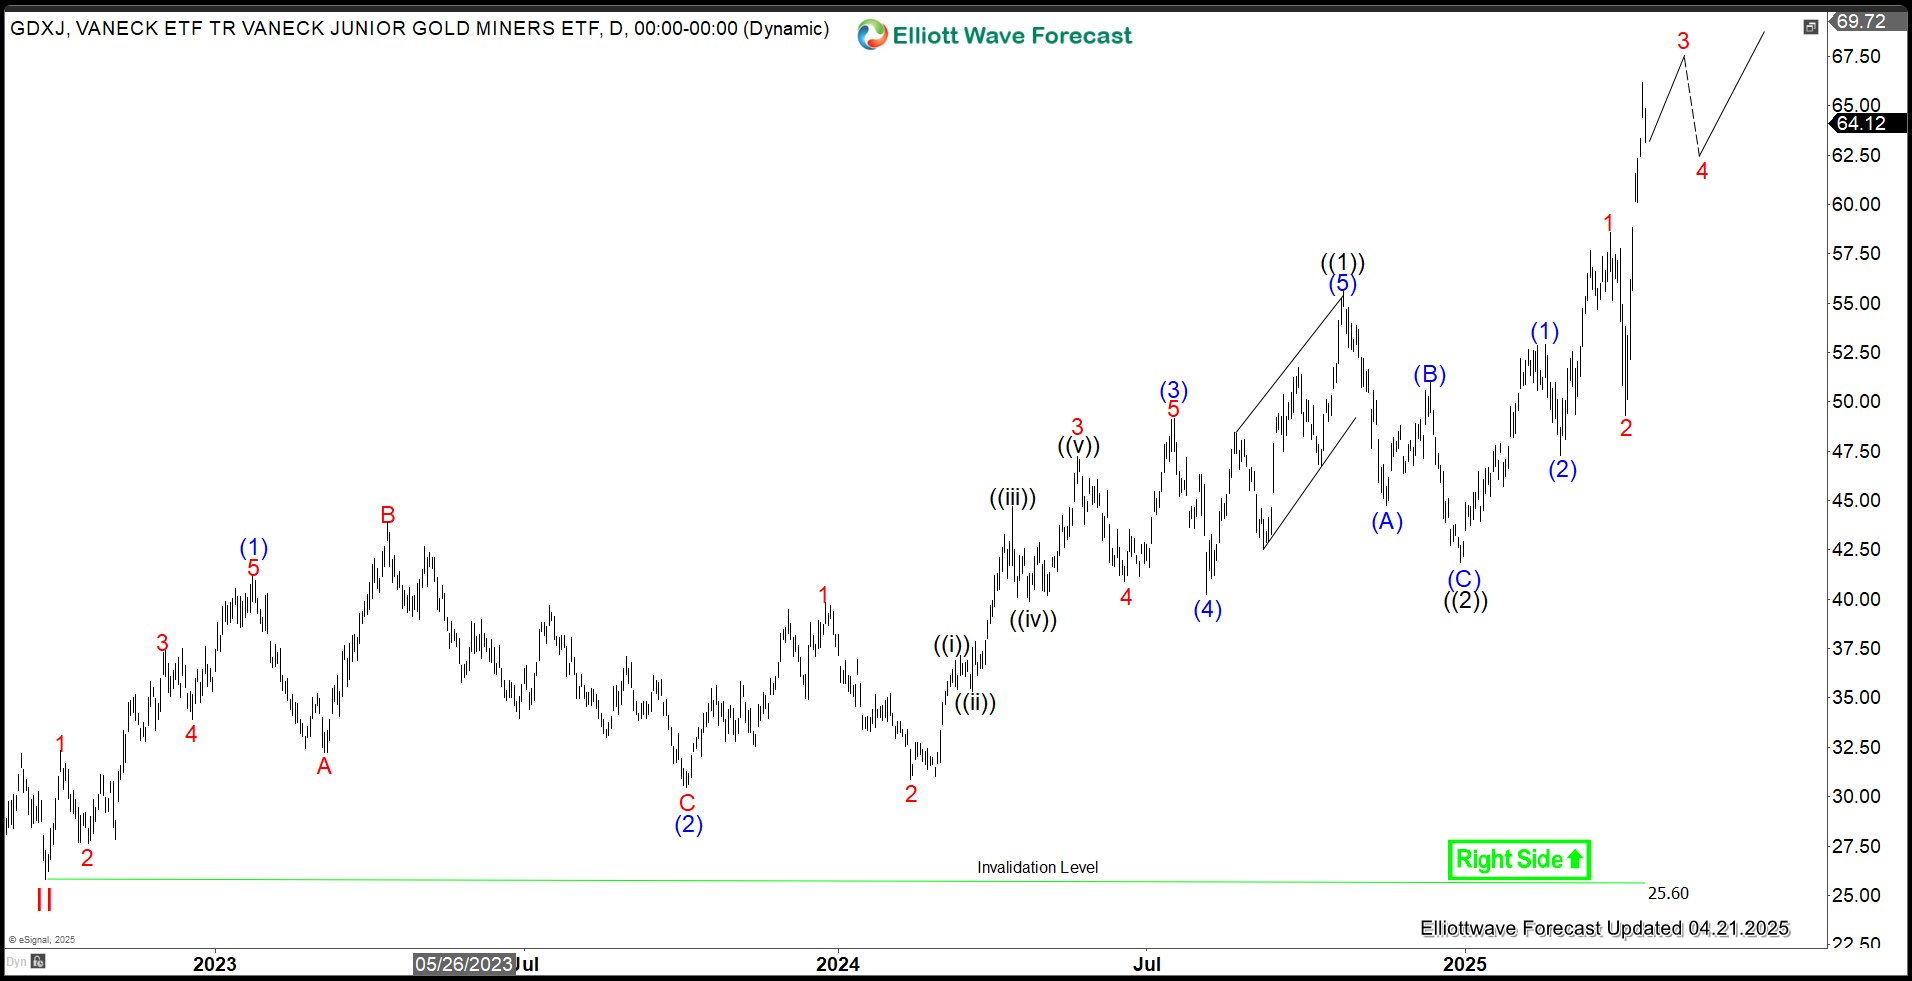
The daily Elliott Wave chart for GDXJ shows that a low of $25.79 marked the end of wave II. From there, the ETF began a strong upward move in wave III, structured as a five-wave pattern. Starting from wave II, wave (1) peaked at $41.16, followed by a dip to $30.46 in wave (2). The ETF then rallied to $49.13 in wave (3), with a pullback to $40.26 in wave (4). The final push, wave (5), reached $55.58, completing wave ((1)) on a larger scale. A correction in wave ((2)) bottomed at $41.85, and the ETF has since resumed its upward trend in a nested impulsive pattern.
GDXJ 4 Hour Elliott Wave View
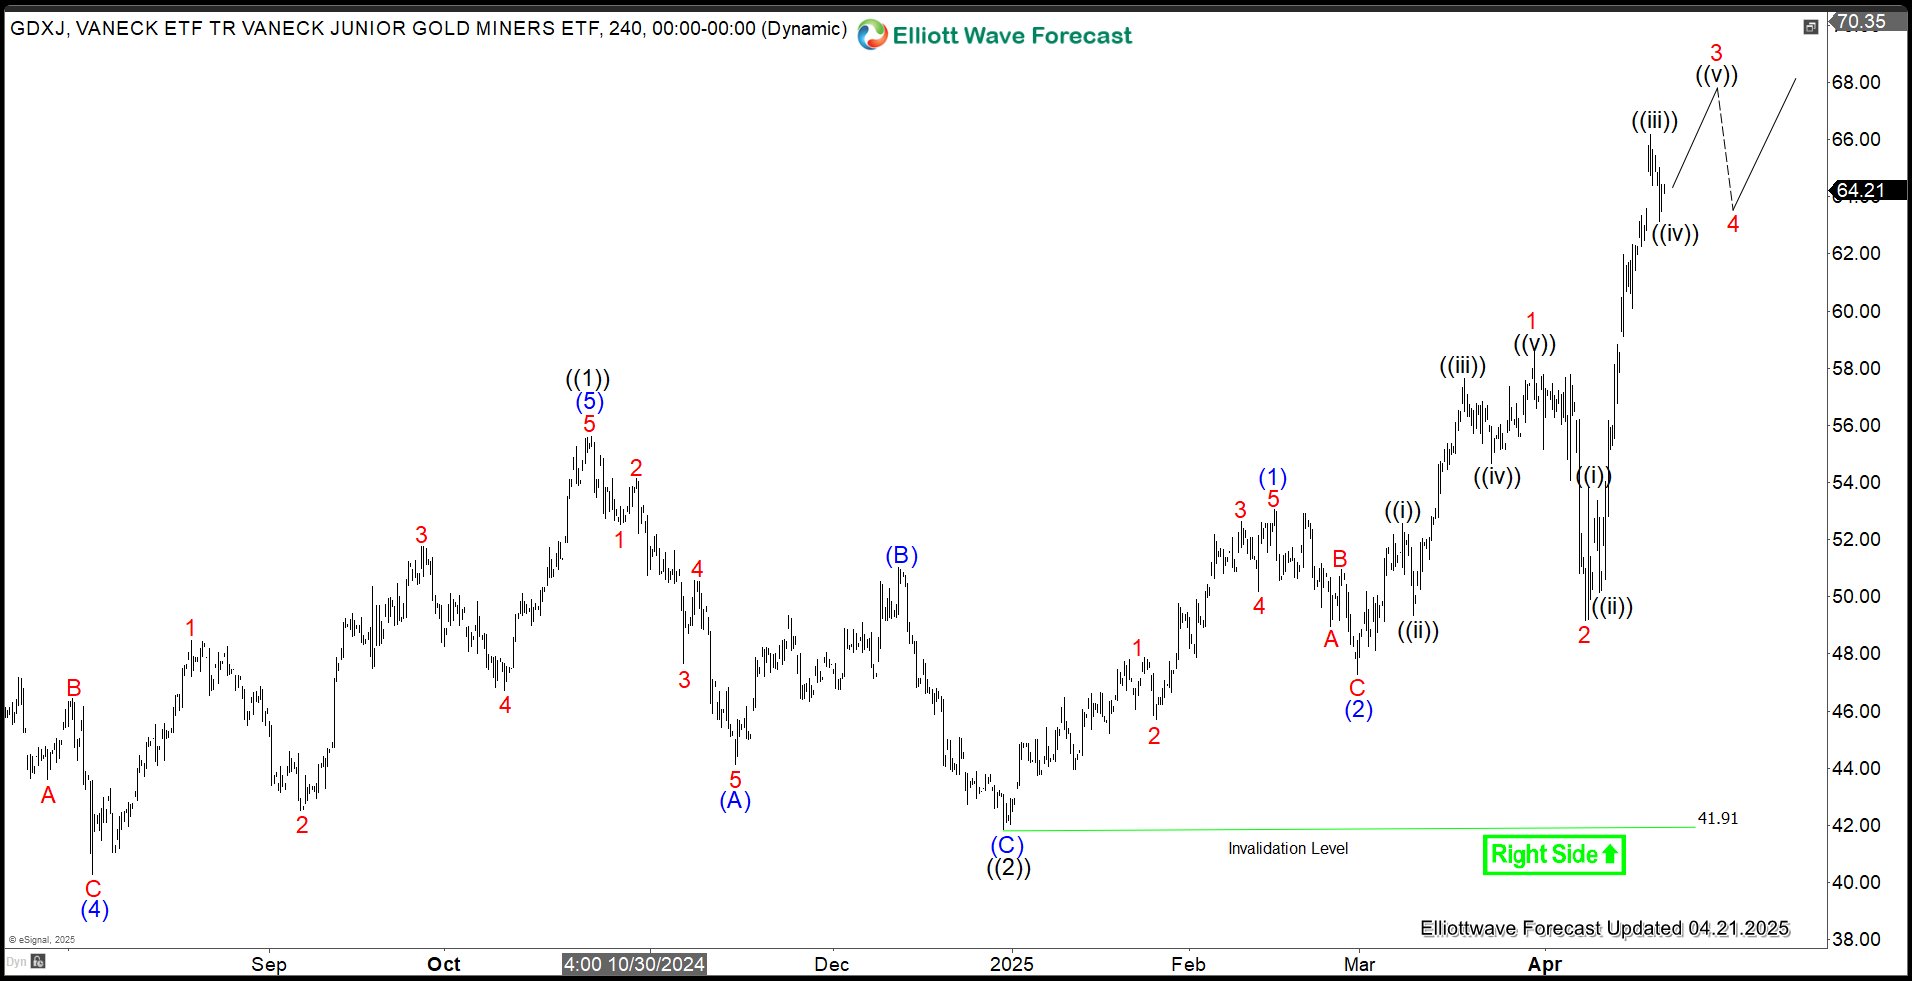
The 4-hour Elliott Wave chart for the Junior Gold Miners ETF (GDXJ) shows that the cycle starting from the September 26, 2022 low peaked at $55.62, completing wave ((1)). A pullback in wave ((2)) followed, forming a zigzag pattern: wave (A) dropped to $44.11, wave (B) rallied to $51.03, and wave (C) fell to $41.91, finalizing wave ((2)). GDXJ then began climbing in wave ((3)) with a nested impulsive structure. From wave ((2)), wave (1) reached $53.05, and a dip in wave (2) ended at $47.29. The ETF continued higher in wave (3), with wave 1 peaking at $58.59 and a pullback in wave 2 bottoming at $49.18. As long as the $41.91 low holds, GDXJ is expected to keep rising in the near term.
