


$FXY Longer Term Elliott Wave Cycles
Firstly the $FXY instrument inception date was 2/12/2007. The instrument tracks changes of the value of the Japanese Yen versus the US Dollar. There is plenty of data going back into the longer term 1970’s time frame available for the currency cross rate in the USDJPY. The foreign exchange pair shows a larger degree time frame low is in place in October 2011 at 75.57. Comparatively, the FXY instrument reflects a price high at 130.22 in October 2011.
The analysis continues below the FXY Monthly chart.
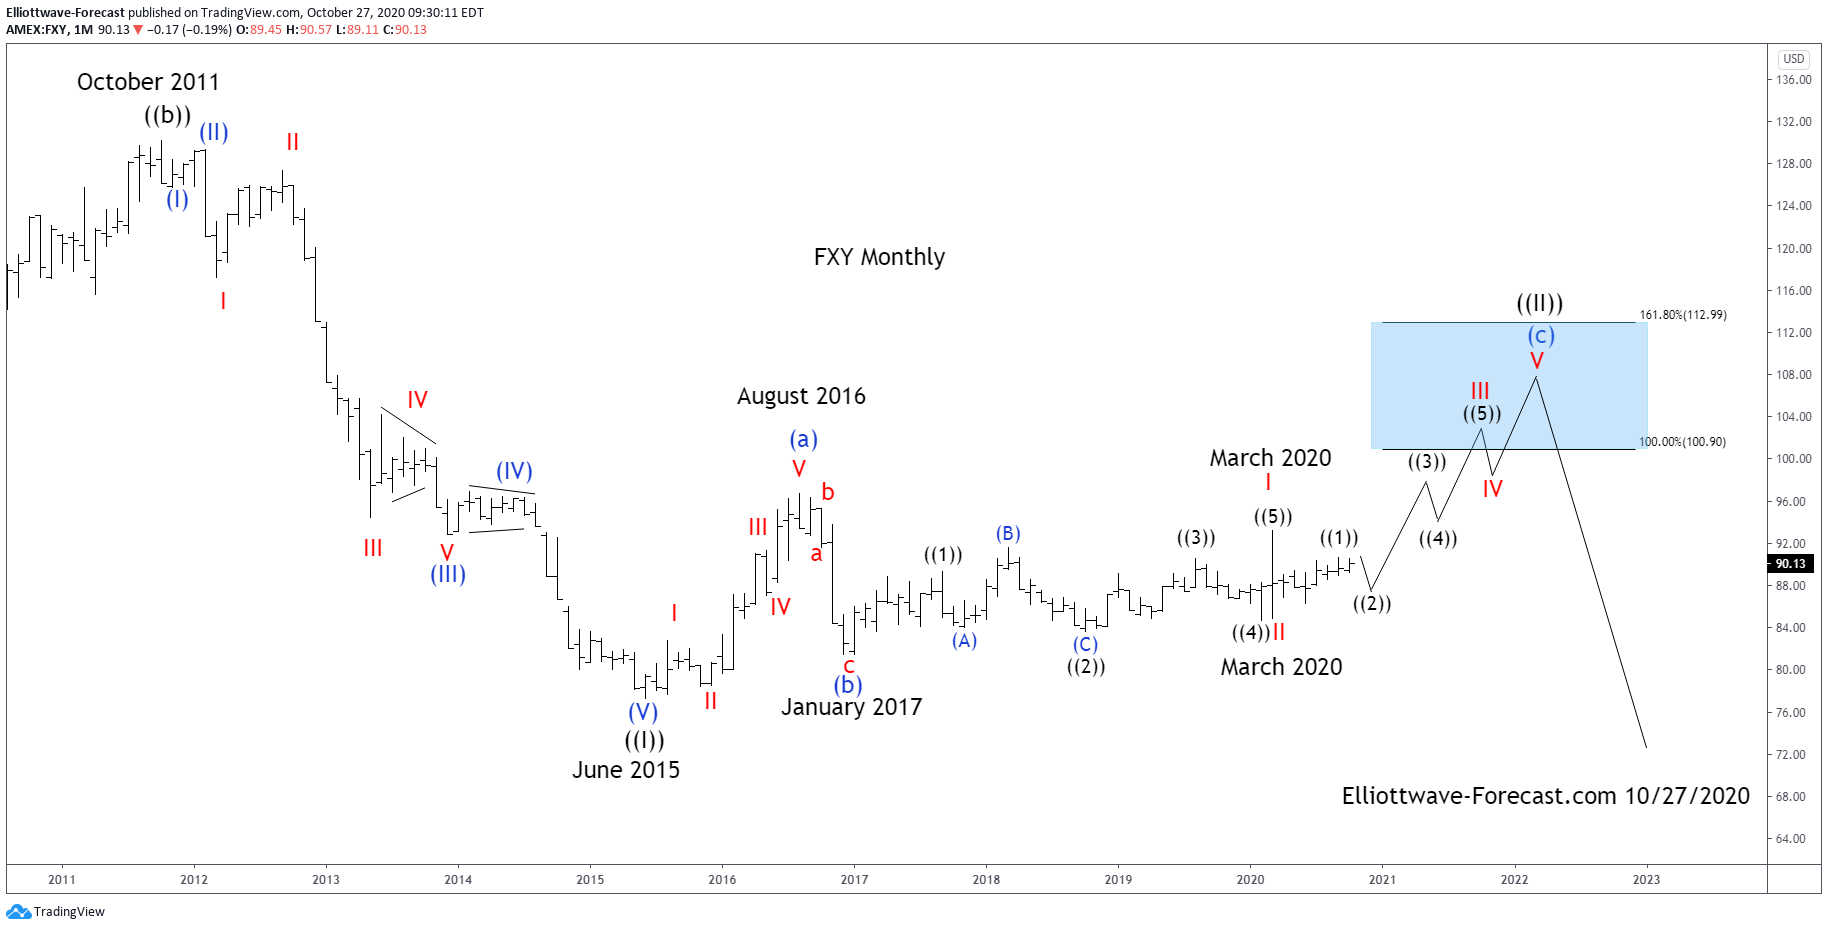
Secondly the FXY instrument mirrors USDJPY price highs and lows inversely as the initial above paragraph suggests. In the FXY instrument the decline from the October 2011 high into the June 2015 lows is an Elliott wave impulse. Internally there are a couple of degrees shown there in the red & blue colors that finished the black wave ((I)). From the June 2015 lows the bounce higher in both price and momentum indicators suggested the cycle lower had ended there.
In conclusion: As the FXY weekly chart suggests the instrument ended a larger degree cycle in an Elliott wave impulse of five waves lower in June 2015. The bounce from there is in five waves as well in the wave (a) in blue that ended August 2016. From there a double three wave (b) in blue ended in January 2017. From there a larger cycle in the red I ended in March 2020. The pullback in the red II was fast however did end March 2020 as well.
Currently & ideally while it is below the September 2020 highs it can see a pullback correct the cycle from the March 2020 lows before turning higher again in the blue (c) of ((II)). While this plays out with price remaining above the January 2017 lows the FXY can see a turn higher. This larger degree ((II)) is a ziz zag Elliott Wave structure. It can reach the 100.90 – 112.99 extension area before the larger degree time frame bearish cycle takes over again taking prices substantially lower.
