


Hello fellow traders. In this technical article we’re going to look at the Elliott Wave charts of Dollar index DXY published in members area of the website. US Dollar has recently given us Double Three pull back and found sellers again precisely at the equal legs area as we expected. In this discussion, we’ll break down the Elliott Wave pattern and forecast.
Elliott Wave Double Three Pattern
Double three is the common pattern in the market , also known as 7 swing structure. It’s a reliable pattern which is giving us good trading entries with clearly defined invalidation levels.
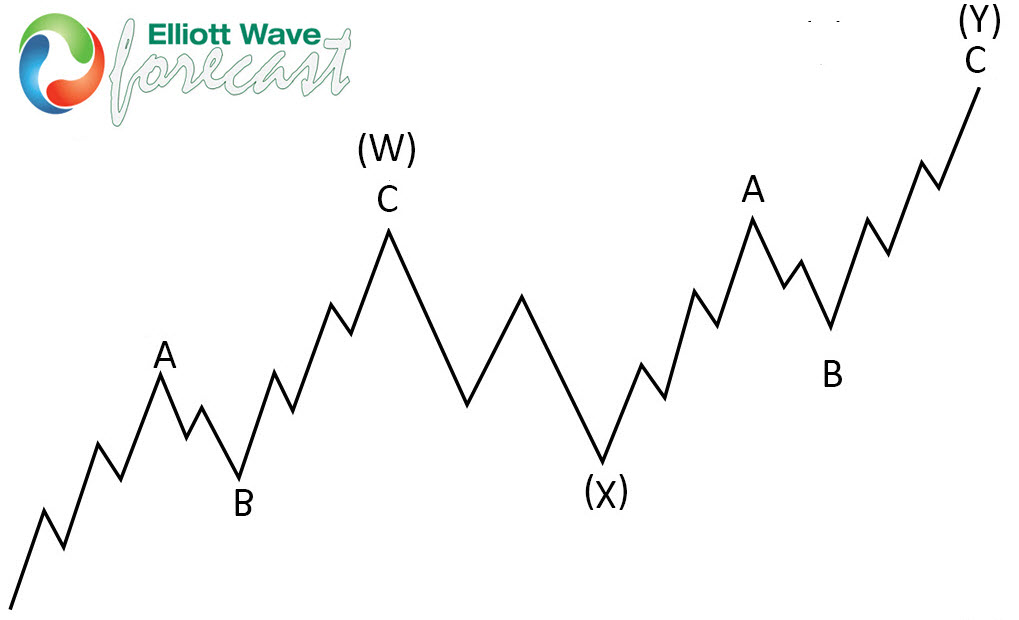
The picture below presents what Elliott Wave Double Three pattern looks like. It has (W),(X),(Y) labeling and 3,3,3 inner structure, which means all of these 3 legs are corrective sequences. Each (W) and (Y) are made of 3 swings , they’re having A,B,C structure in lower degree, or alternatively they can have W,X,Y labeling.
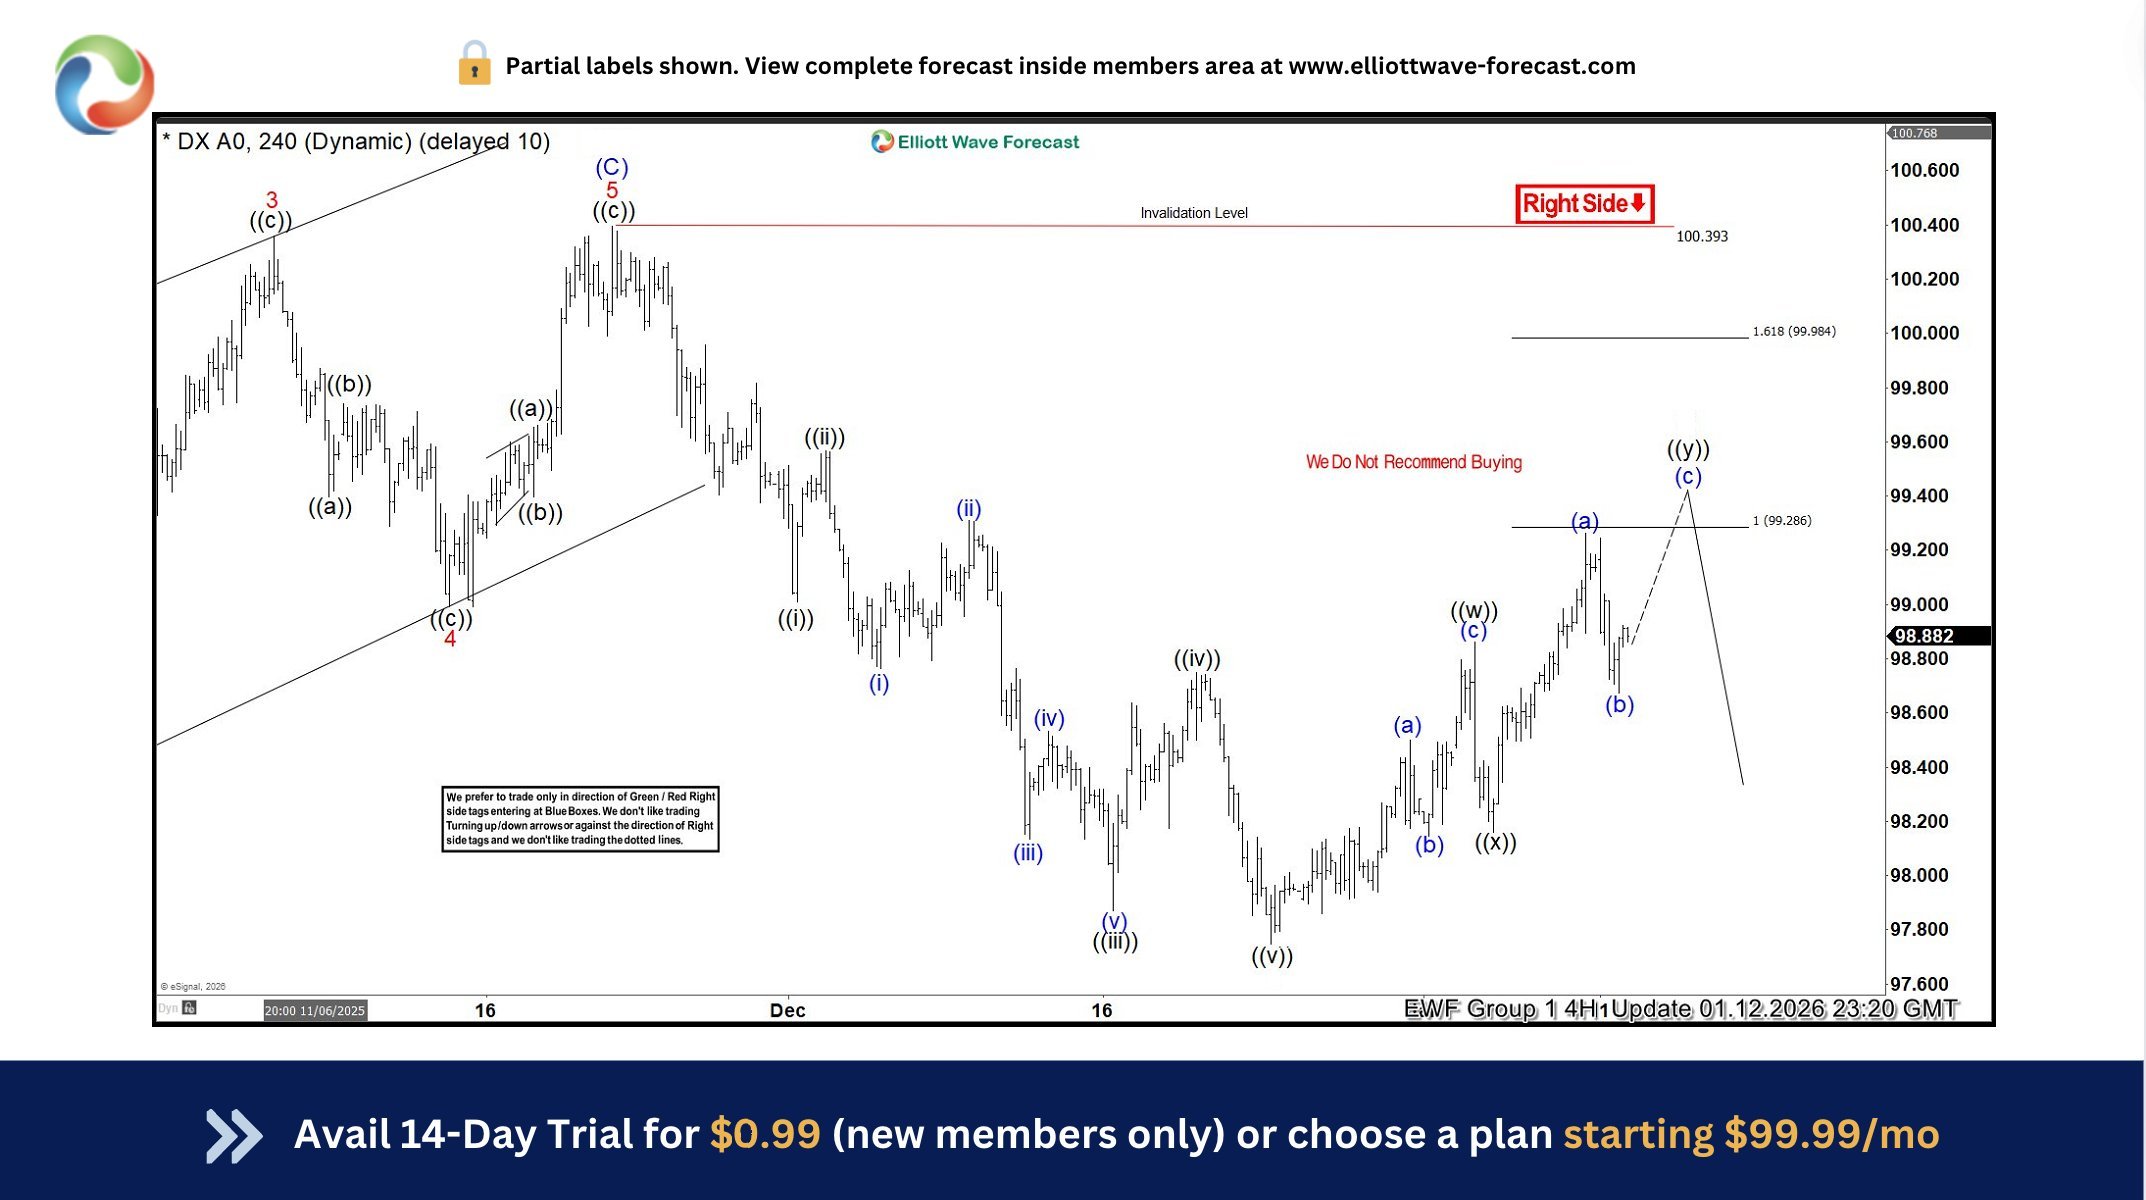
DXY Elliott Wave 4 Hour Chart 01.12.2026
DXY is forming a Double Three pattern. As our members know, we identify potential reversal zones using the Equal Legs technique — in this case, the sellers’ area lies at 99.286–99.984. The correction looks incomplete at the moment. We expect the Dollar to make another wave up to complete a 7-swing pattern. As long as the price stays within this region, we expect sellers to take control and push it down toward new lows. We recommend that members avoid buying the Dollar at this stage, while favoring the short side.
You can learn more about Elliott Wave Patterns at our Free Elliott Wave Educational Web Page
90% of traders fail because they don’t understand market patterns. Are you in the top 10%? Test yourself with this advanced Elliott Wave Test
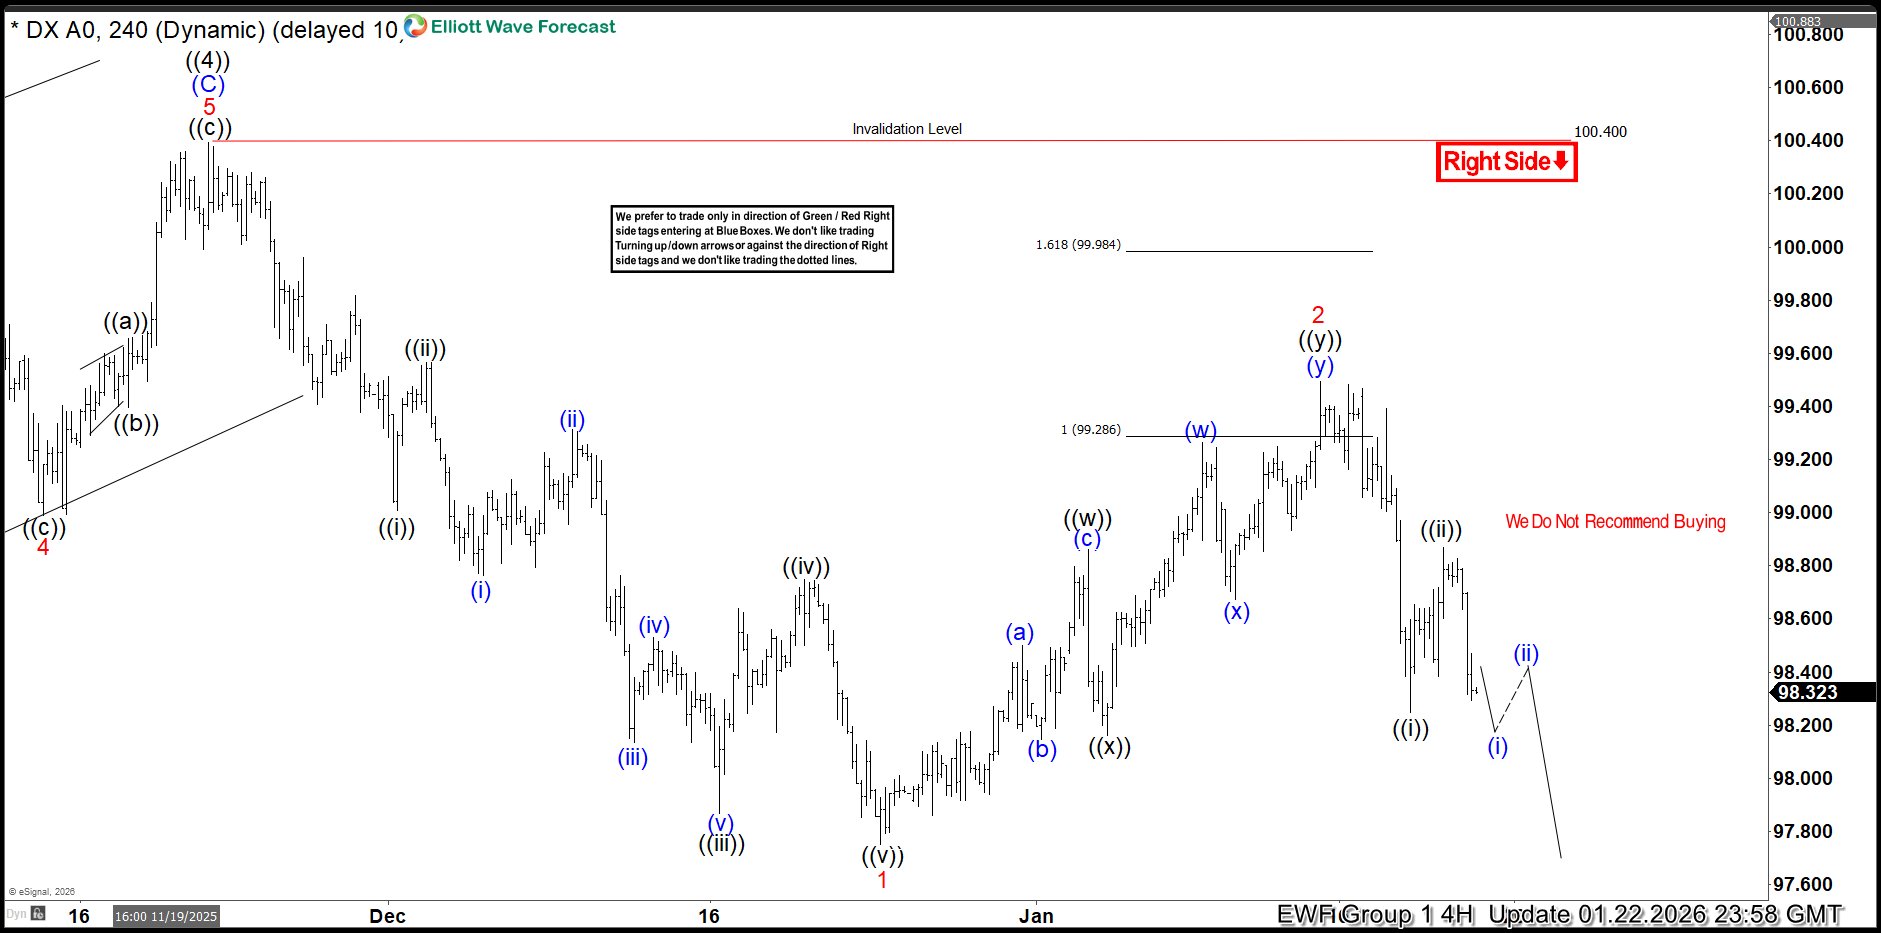
DXY Elliott Wave 4 Hour Chart 01.12.2026
The Dollar found sellers at the marked Equal Legs zone, as expected. DXY made a sharp drop from the sellers’ zone. The recovery peaked at 99.492. As long as it remains below that high, the next leg down should be in progress toward new lows. We expect to see break of December 23rd low in upcoming days.
Remember, the market is dynamic, and the presented view may have changed in the meantime. For the most recent charts and target levels, please refer to the membership area of the site. The best instruments to trade are those with incomplete bullish or bearish swing sequences. We put them in Sequence Report and best among them are presented in the Live Trading Room
Reminder for members: Our chat rooms in the membership area are available 24 hours a day, providing expert insights on market trends and Elliott Wave analysis. Don’t hesitate to reach out with any questions about the market, Elliott Wave patterns, or technical analysis. We’re here to help.
Source: https://elliottwave-forecast.com/forex/dollar-index-dxy-elliott-wave-forecasting-decline/
