


AUDCHF is on the verge of completing a multi-decade bearish cycle from April 1992. However, it appears sellers will continue to push in the shorter cycles. Thus, the pair should attract short-term sellers, while long-term sellers should watch out.
AUDCHF has been in a long-term bearish cycle from April 1992 in a somewhat corrective sequence. The structure appears to be a double zigzag — a 7-swing structure. Wave (W) of the supercycle degree ended in October 2008. Afterwards, the corresponding wave (X) bounce followed and ended in August 2012. Since August 2012, the pair has been in another bearish cycle for wave (Y). Meanwhile, wave (Y) has now reached the 100% extension of wave (W) from (X) — which could indicate completion. It's also notable that wave C of (Y) is completing an ending diagonal structure from September 2014. Overall, the entire cycle from April 1992 may very well end within the 0.5385–0.4213 extreme zone.
A closer look at the diagonal wave C shows its sub-waves — waves ((1)), ((2)), ((3)), and ((4)) — ended in January 2015, February 2017, March 2020, and February 2021 respectively. Thus, the last known bearish cycle within this long-term bearish market is wave ((5)) of C of (Y), which started in February 2021.
AUDCHF Weekly Chart Analysis
[caption id="attachment_963104" align="aligncenter" width="1024"]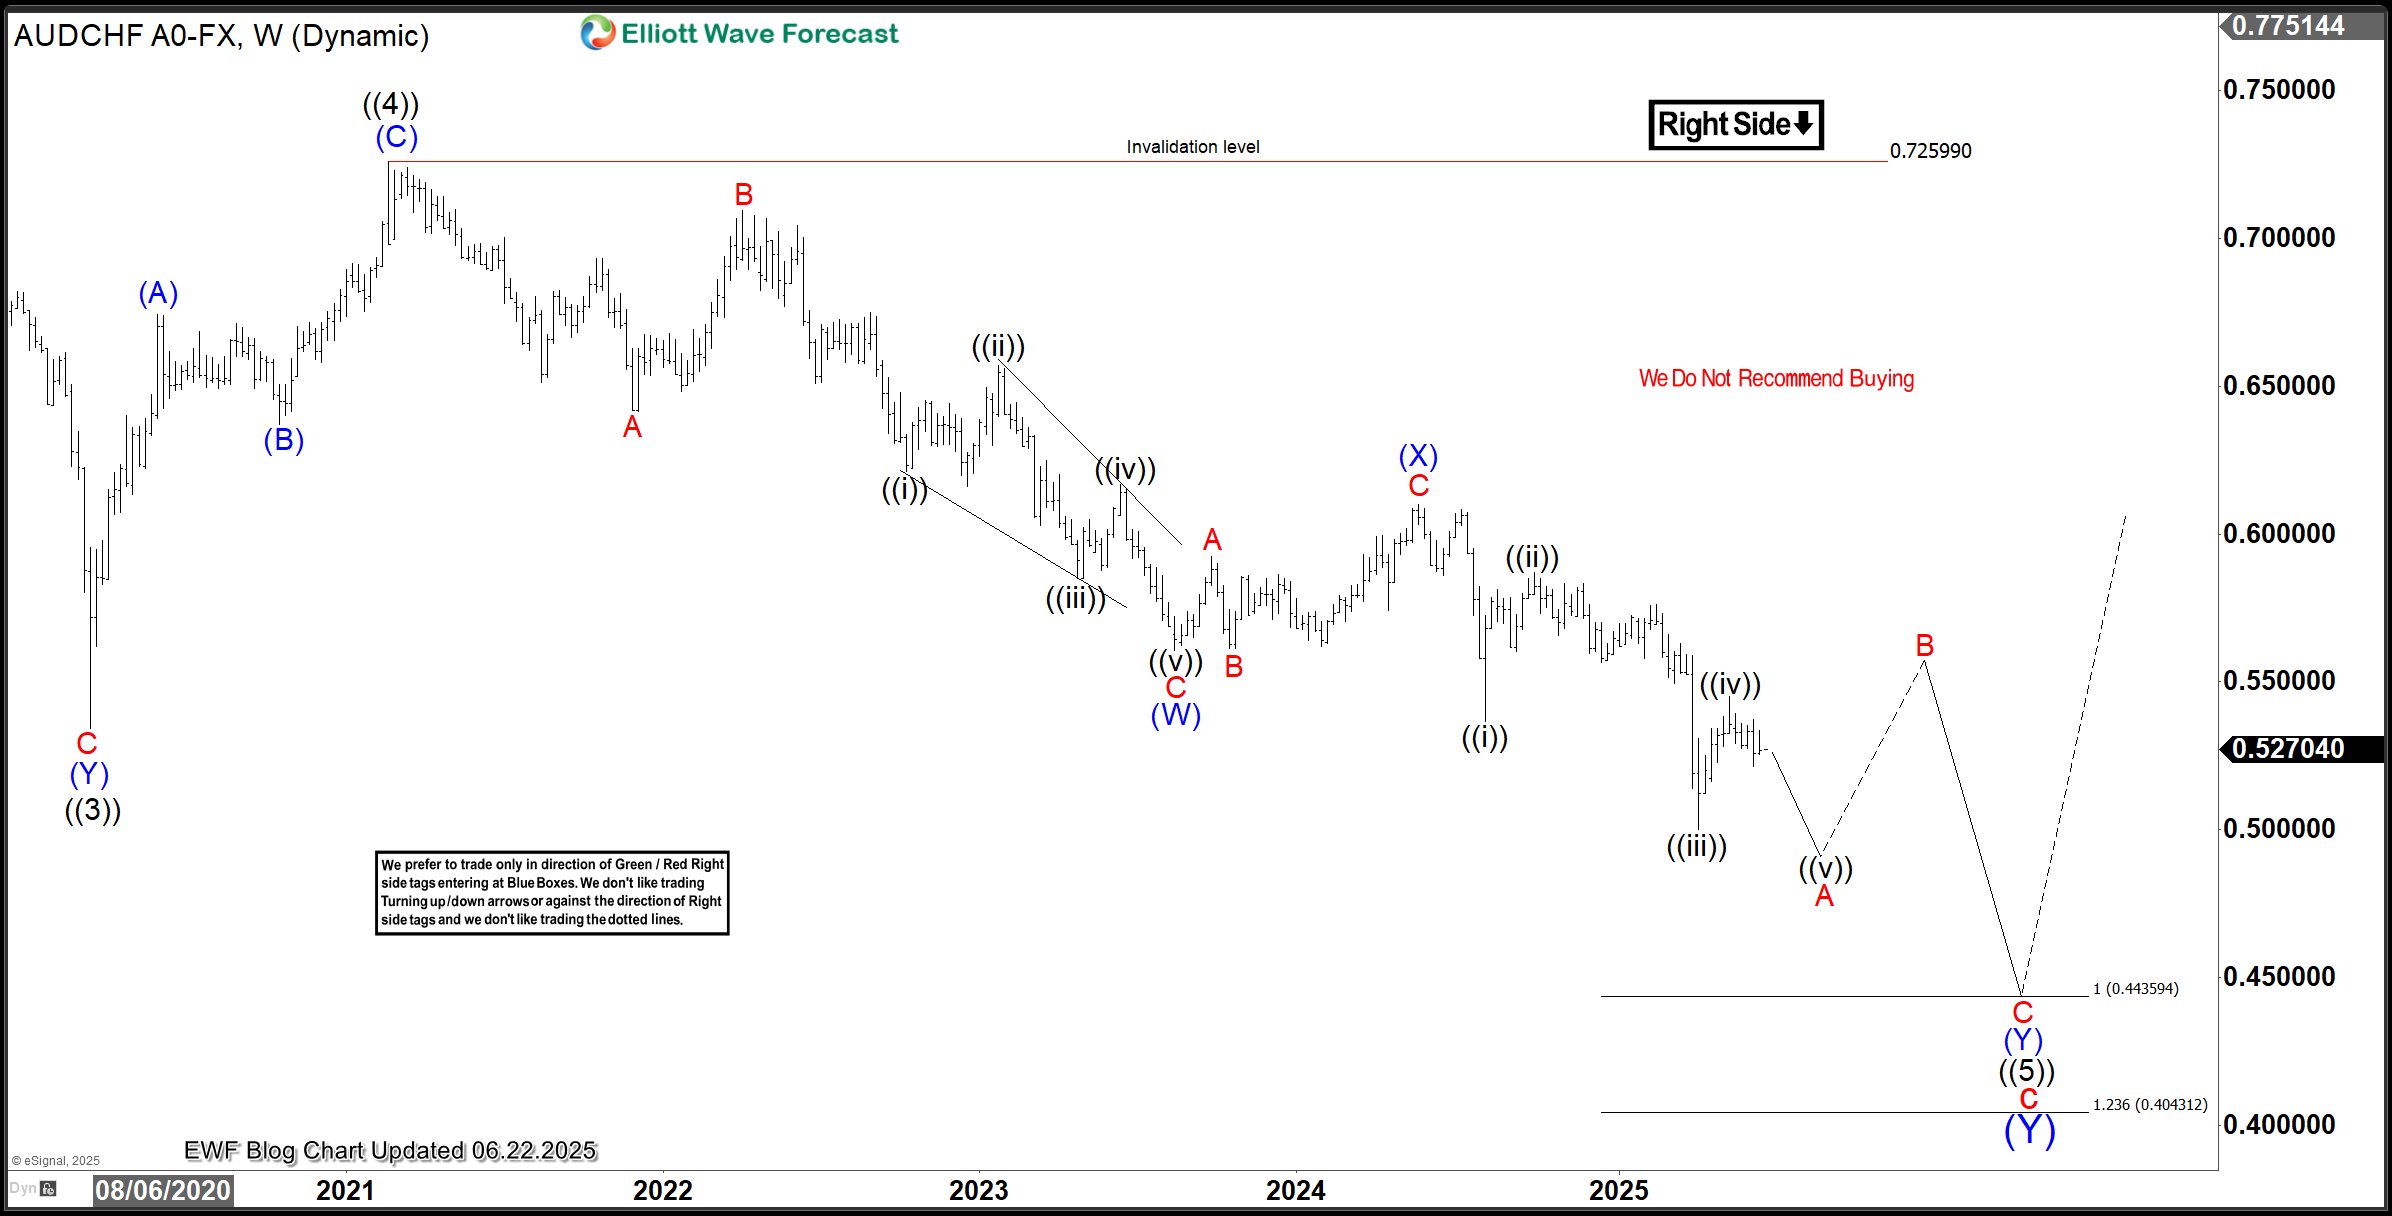 AUDCHF Weekly[/caption]
On the weekly chart above, the wave ((4)) cycle from February 2021 is evolving as a double zigzag structure. Wave (W) of ((5)) ended in August 2023. Afterwards, a corrective bounce for wave (X) followed to the high of May 2024 and then returned to the downside. The break of the wave (W) low opened fresh opportunities for sellers from the extremes of bounces.
The weekly chart shows the price still in wave A of (Y) of ((5)), likely to finish a diagonal structure. A closer look shows price has completed wave ((iv)) of A and is now in ((v)) of A. Thus, it supports selling bounces from the extremes of 3/7/11 swing structures on the shorter cycle, as the wave ((5)) cycle could extend to the 0.4435–0.4043 extreme — which is within the 0.5385–0.4213 extreme.
AUDCHF H4 Chart Analysis
[caption id="attachment_963105" align="aligncenter" width="1024"]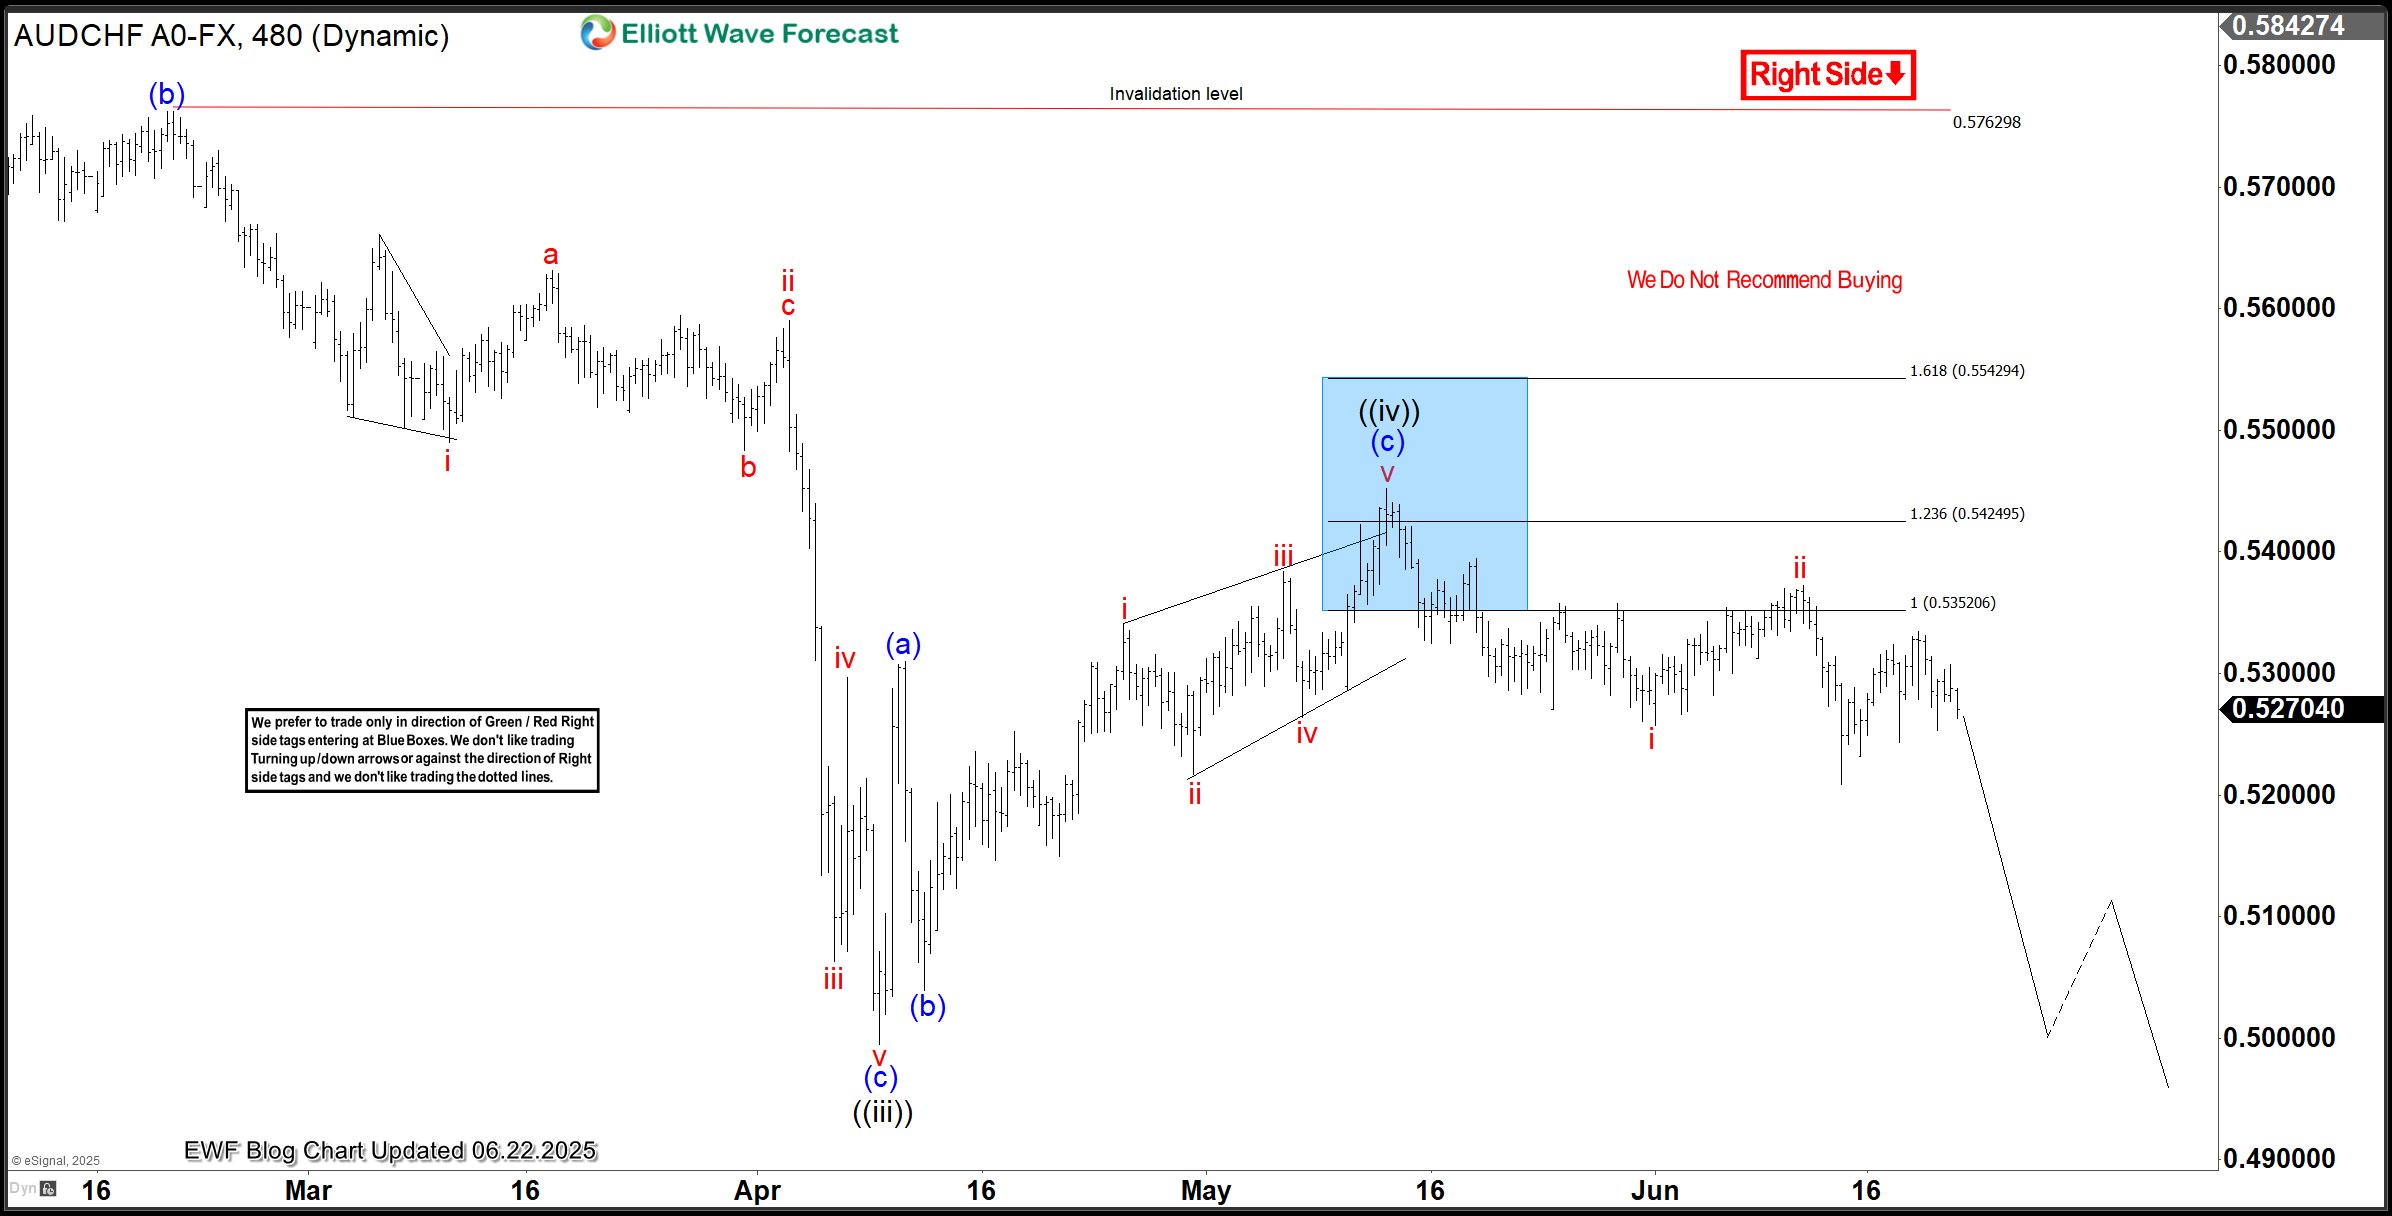 AUDCHF, H4[/caption]
On the H4 chart above, the wave ((iv)) bounce found resistance at the extreme (blue box), and sellers sold. In the coming days, the pair is expected to reach at least 0.5178–0.5132, where sellers from the blue box could take some profit.
Going forward, sellers should either sell higher if ((iv)) makes a double correction higher, or wait for ((v)) to break below the ((iii)) low and then sell the next 3/7/11 swing bounce off the blue box. Ultimately, the next big opportunity will be to sell off the extreme of wave B, as the weekly chart shows.
Source: https://elliottwave-forecast.com/forex/audchf-extends-bearish-sequence-bluebox/
