Elliottwave Forecast Blog | Token PENDLE Looking for Reaction from Blue Box Area | TalkMarkets
ElliotWave Forecast
Contributor's Links: Elliottwave Forecast
At Elliottwave-Forecast, we offer 24 hour coverage of 52 instruments from Monday – Friday using Elliott Wave Theory as primary tools of analysis. We provide Elliott Wave chart in 4 different time frames, up to 4 times a day update in 1 hour chart, two live sessions by our expert analysts, 24 ...more

Token PENDLE Looking for Reaction from Blue Box Area

Date: Wednesday, September 18, 2024 3:17 PM EST

PENDLE is a DeFi protocol focused on yield trading, allowing users to both fix or leverage their yield. In today’s blog, we’ll explain the daily Elliott Wave structure taking place and show the potential outcome for the token.

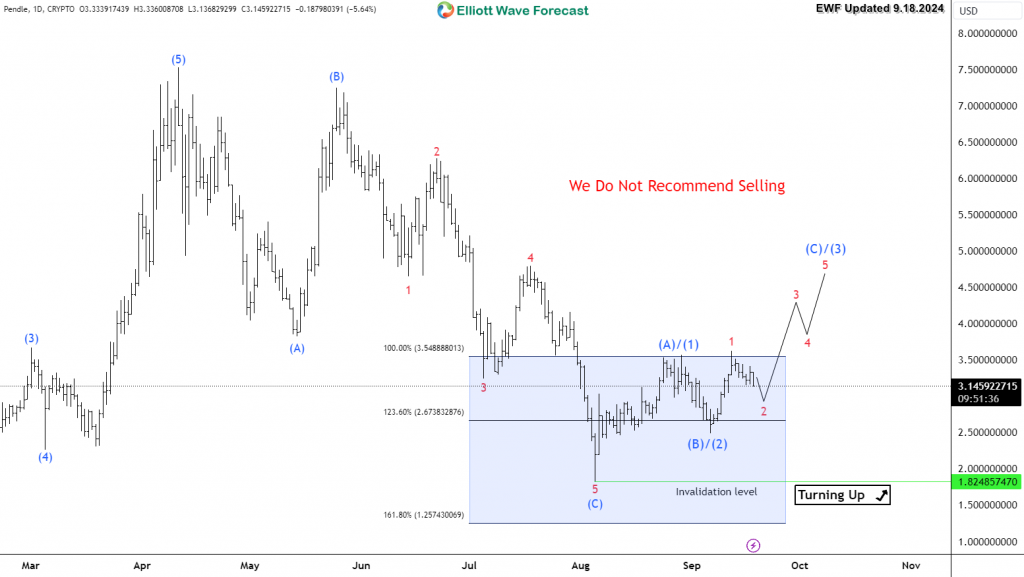
Since April 2024, PENDLE started its correction to the downside and it lost 75% of its value. The move from the peak unfolded within a 3 waves ZigZag structure. This Elliott Wave corrective structure results on a reversal to take place. The token reached the equal legs area at $3.5 – $1.25 from where it ended the daily move to the downside.

The blue box showing in our chart is a technical area where we expect PENDLE to find Buyers and react higher. Up from there, it’s expected to turn to the upside either to start a new 5 waves advance or at least bounce in 3 waves from there.

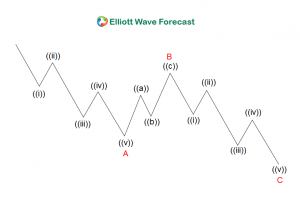
Elliott Wave ZigZag Structure

zig zag

PENDLE Daily Chart 9.18.2024

PENDLE 2024-09-18


Source: https://elliottwave-forecast.com/cryptos/token-pendle-daily-blue-box-area/

Disclaimer: This and other personal blog posts are not reviewed, monitored or endorsed by TalkMarkets. The content is solely the view of the author and TalkMarkets is not responsible for the content of this post in any way. Our curated content which is handpicked by our editorial team may be viewed here.

Comments

Leave a comment to automatically be entered into our contest to win a free Echo Show.
Or Sign in with