
What Is A Calendar Spread?

Introduction
A calendar spread is an option trade that involves buying and selling an option on the same instrument with the same strikes price, but different expiration periods.
It is sometimes referred to as a horizonal spread, whereas a bull put spread or bear call spread would be referred to as a vertical spread.
A standard set up would involve selling the front-month option and buying an option in the next expiry period or further out in time. The trade can also be set up using weekly options.
The further out in time the trader goes to buy the option, the more expensive the trade will be.
Usually traders would set this as an at-the-money spread, but they can also be set up as directional trades with either a bullish or bearish outlook.
Generally if trading a bullish calendar spread I would use calls and for a bearish calendar spread I would use puts. This helps reduce the risk of early assignment.
A calendar spread is a long volatility trade so tends to benefit from rising volatility after the trade is placed.
When the market is in Backwardation can be a good time to enter calendar spreads because the front month volatility is higher than the back month.
In some respects at-the-money calendar spreads are a bit of an oxymoron because it’s a neutral trade that does well if the stock stays flat, but it’s also a long volatility trade which benefits from increased volatility.
The main premise with the trade is that the short-dated options that are sold will experience faster time decay than their longer-dated counterpart. As long as the underlying asset stays inside the profit zone, the trade should do well.
Maximum Loss
A calendar spread is a debit spread and as such the maximum that the trader can lose is the amount paid to enter the trade.
The sold option is shorter-dated and therefore cheaper than the long-dated option that is being bought which results in a net debit for the trader.
A calendar spread has a similar shaped payoff diagram to a short straddle but the maximum loss is limited whereas the maximum loss on the short straddle is theoretically unlimited.
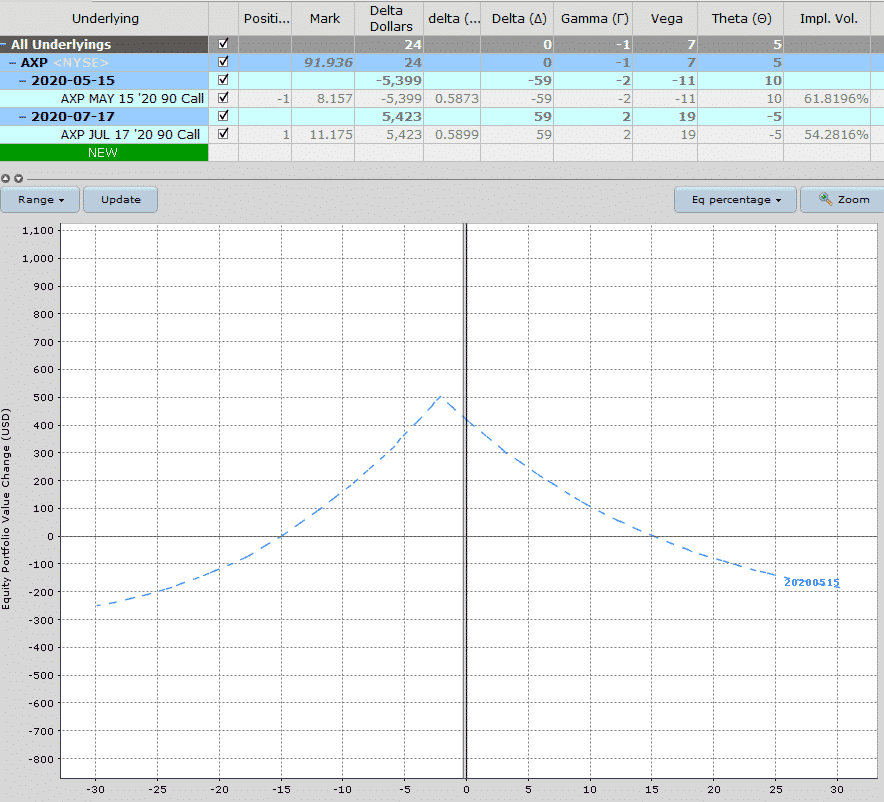
With a calendar spread, the underlying stock would need to make a pretty big move for the trade to suffer a full loss.
Looking at this example on AXP, the stock would need to have a 30% down move or 25% up move before suffering the maximum loss. Usually traders would adjust or close long before then.
Maximum Gain
The maximum gain on a calendar spread can’t actually be worked out in advance because it’s impossible to know what the back-month option will be trading for when the front-month option expires.
This is due to changes in implied volatility.
The ideal scenario for the trade is that the stock ends near the short strike at the expiration of the near-term option.
Ideally this would be associated with an increase in implied volatility in the back-month option.
The increase in implied volatility in the back-month help to offset any negative effects from time decay.
Some traders like to hold the long call as a stand-alone trade after the short call expires. The expired short call helps offset the cost of the long call.
Another idea is to make the trade a “campaign calendar” where the bought option is 3-4 months out and the trader gets the chance to sell 2-3 at-the-
money calls over the life of the trade.
Breakeven Price
Like the maximum gain, the exact breakeven price can’t actually be calculated but we can estimate it.
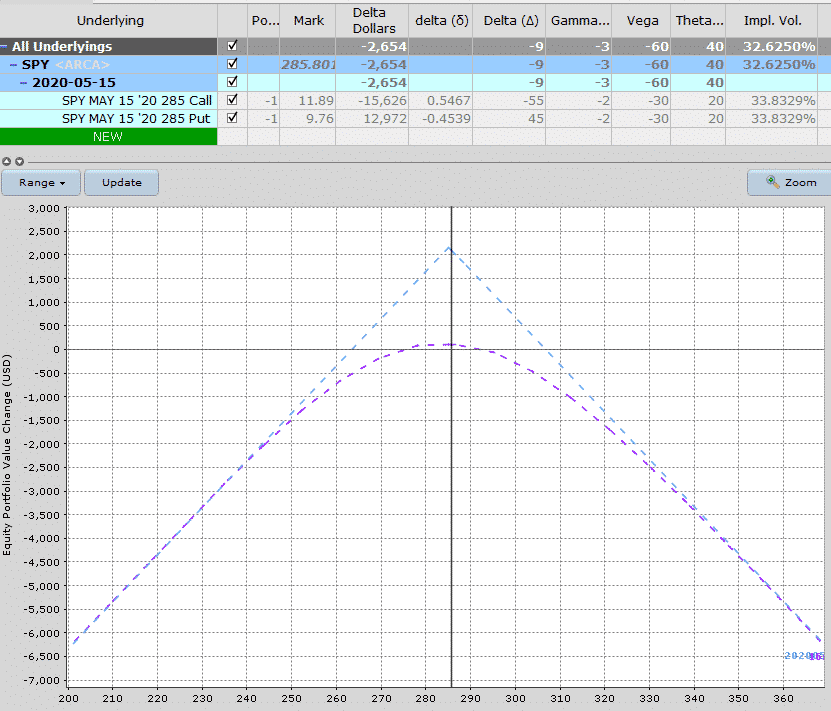
Looking this SPY example, we can see that the breakeven points are estimate around $267 and $305

One theory with calendar spreads is to ensure that the premium paid for the long call is no more than 40% more expensive than the bought option when the strikes are one month apart.
Payoff Diagram
Calendar spreads have a tent shaped payoff diagram similar to what you would see for a butterfly or short straddle.
This sort of shape results in high gamma near expiry which we’ll look at in more detail shortly.
However, the losses tend to flatten out a bit more along the expiration line for calendar spreads vs a butterfly or short straddle.
The payoff diagram below shows a standard setup for an SPY Calendar Spread. You can see that the total potential profit is estimated at around $700 and the maximum loss is $475.
The T+0 zero line is relatively flat and losses don’t really kick in until about $270 on the downside and $305 on the upside.
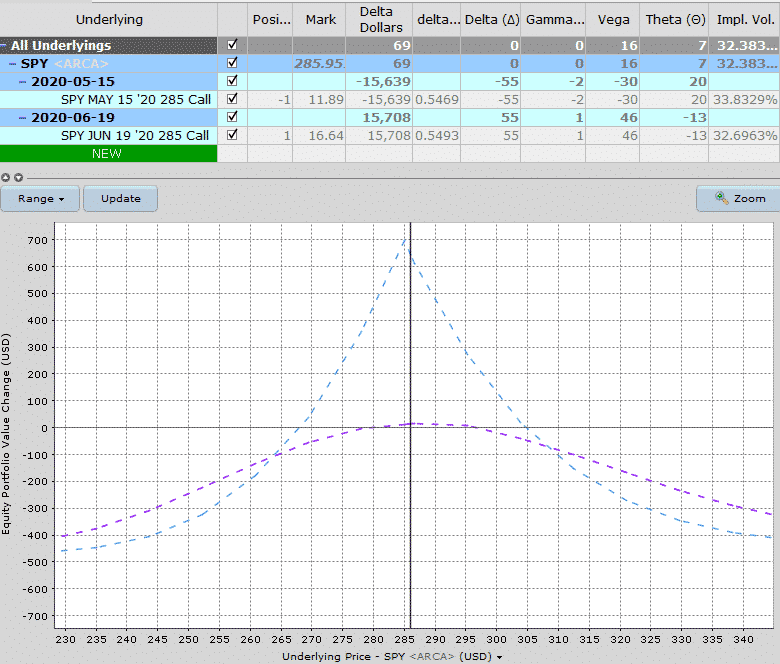
One thing I tend to do with calendar spreads and setting either an adjustment point or a stop loss is to look at the T+7 line and see where is cuts through the zero line on the x-axis.
That’s where I set my stop loss or adjustment point.
In this case that would also be around the $270 and $305 level.
Risk Of Early Assignment
There is always a risk of early assignment when having a short option position in an individual stock or ETF.
You can mitigate this risk by trading Index options, but they are more expensive.
Usually early assignment only occurs on call options when there is an upcoming dividend payment. Traders will exercise the call in order to take ownership of the share before the ex-date and receive the dividend.
Short puts can also be assigned early. The important thing to be aware of is that early assignment generally happens when a short option is in-the-money.
For this reason, if I’m trading directional calendars I use puts for bearish bets and calls for bullish bets. That way the short options are likely to stay out-of-the-money which significantly decreases the chance of early assignment.
How Volatility Impacts Calendar Spreads
Calendar spreads are long vega trades, so generally speaking they benefit from rising volatility after the trade has been placed.
Vega is the greek that measures a position’s exposure to changes in implied volatility. If a position has negative vega overall, it will benefit from falling volatility.
If the position has positive vega, it will benefit from rising volatility. You can read more about implied volatility and vega in detail here.
Looking at the SPY example above above, the position starts with a vega of 16. This means that for every 1% risk in implied volatility, the trade should gain $16.
The opposite is true if implied volatility drops – the position would lose $16.
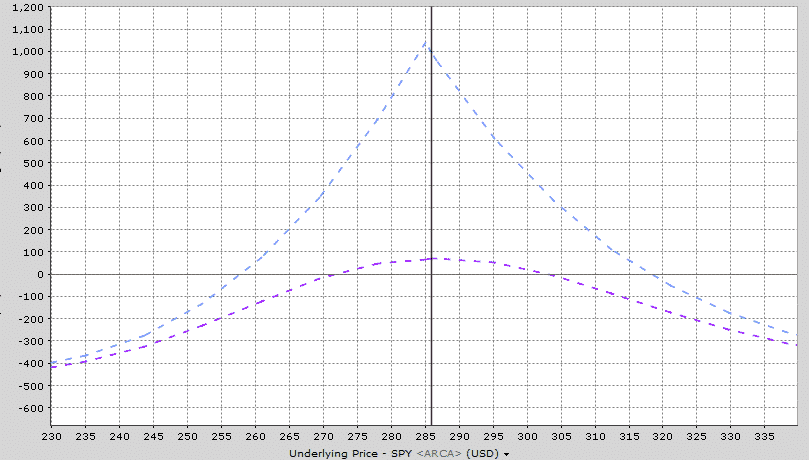
Below is an estimate of what the new payoff diagram looks like assuming a 30% increase in implied volatility. Notice that the maximum gain is now estimated at $1,050 rather than $700.
Of course, the opposite would happen if volatility dropped by 30%.
How Theta Impacts Calendar Spreads
Calendar Spreads are positive Theta trades in that they make money as time passes, with all else being equal.
This is due to the fact that the short call suffers faster time decay than the bought call.
This is especially true if the bought call is much further out in time (I.e. more than just one month).
In our SPY example, the trade has positive Theta of 7. This means that, all else being equal, the trade will gain $7 per day due to time decay.
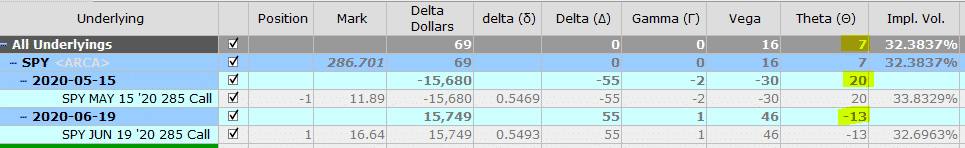
Notice that the positive time decay on the short-term sold call is higher than the time decay being suffered on the longer-dated long call.
We can see this even more if we extend the long call out further in time. This position has overall positive theta of 14 because the December call is only losing $6 per day compared to the June call which was losing $13 per day.
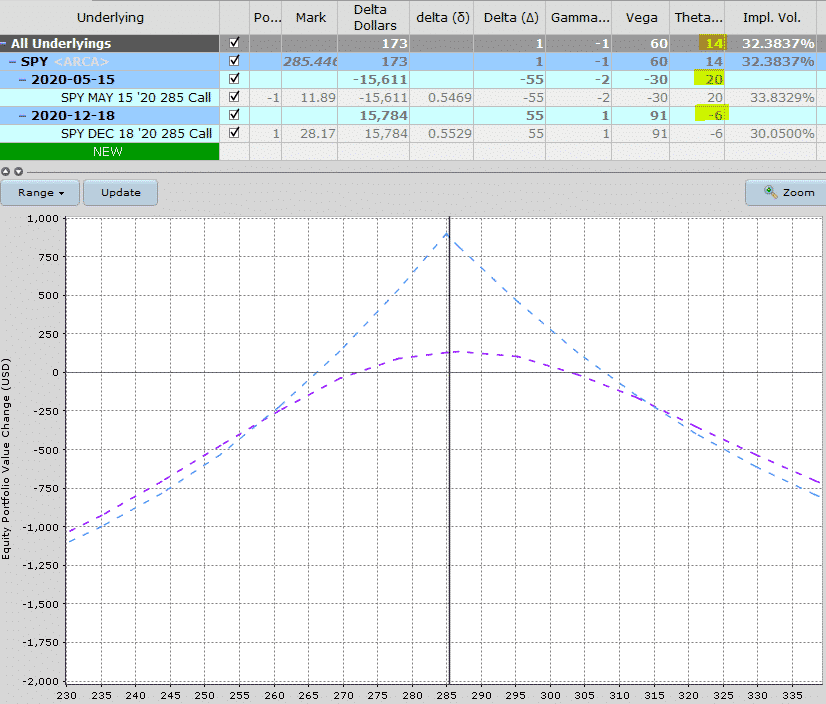
The trade off here is that the December call option costs a lot more requiring the trader to allocate more capital to the trade. But they can turn the trade into a campaign calendar and sell calls against the long call position every month.
Calendar Spread Greeks
DELTA
Standard calendar spreads are delta neutral, or close to, if placed at-the-money.
The calendar can also be placed with a bullish or bearish bias by placing the spread above or below the current stock price.
Our initial SPY position above had a delta of exactly 0. There is not directional exposure at the initiation of the trade. Of course, that will change as the stock starts to move.
If the stock rallies, the spread will then be below the current price resulting in negative delta.
If the stock falls, the spread will then be above the current price resulting in positive delta.
GAMMA
Calendar spreads are negative gamma. Generally any trade that has a profit tent above the zero line will be negative gamma because they will benefit from stable prices.
Gamma is one of the lesser known greeks and usually, not as important as the others.
I say usually, because you’ll see further down in this post why it can be really important to understand gamma risk.
Calendar spreads maintain a bit of a natural hedge because they are negative gamma, but positive vega.
The ideal scenario is that implied volatility rises (good for positive Vega) but realized volatility remains low (good for negative Vega).
In other words you want the stock to stay relatively flat, but show a rise in implied volatility (the expectation of future big price moves).
In our SPY example the initial calendar with the long call in June had 0 gamma while the position that used the December long call had gamma of -1.
As you can see, the initial impact of delta and gamma on a calendar spread are pretty low, but that can change as time passes and the stock starts to move.
Risks
It goes without saying that as a neutral trade, we have a risk that the price of the underlying will rise or fall sharply causing an unrealized loss, or a realized loss if we close the trade.
Some other risks associated with calendar spreads:
ASSIGNMENT RISK
We talked about this already so won’t go into to much detail here and while this doesn’t happen often it can theoretically happen at any point during the trade.
The risk is most acute when a stock trades ex-dividend.
If the stock is trading well below the sold call, the risk of assignment is very low. E.g. a trader would generally not exercise his right to buy SPY at $280 when SPY is trading at $270 purely to receive a $0.50 dividend.
The risk is highest if the stock is trading ex-dividend and the short call is in the money.
One way to avoid assignment risk is to trade stocks that don’t pay dividends, or trade indexes that are European style and cannot be exercised early.
However, this should not be the primary factor when determining which underlying instrument to trade.
Otherwise, think about closing your calendar spread before the ex-dividend date if they are close to being in-the-money.
EXPIRATION RISK
Leading into expiration, if the stock is trading just above or just below the short call, the trader has expiration risk.
The risk here is that the trader might get assigned and then the stock makes an adverse movement before he has had a chance to cover the assignment.
In this case, the best way to avoid this risk is to simply close out the spread before expiry.
While it might be tempting to hold the spread and hope that the stock drops and stays below the short call, the risks are high that things end badly.
Sure, the trader might get lucky, but do you really want to expose your account to those risks?
VOLATILITY RISK
As mentioned on the section on the greeks, this is a positive vega strategy meaning the position benefits from a rise in implied volatility.
If volatility falls after trade initiation, the position will likely suffer losses.
The other risk with volatility relates to the volatility curve.
Generally speaking, when volatility rises or fall it has a similar impact across all expiration periods.
However, you could potentially run into a scenario where volatility in the front month rises (bad for the short call) and volatility in the back month drops (bad for the long call).
That would result in a double whammy for the trade.
That scenario may not be that common but it could happen and it’s important that trades understand volatility term structure when placing trades that span different expiration periods.
Calendar Spread vs Diagonal Spread
The main difference in a calendar spread vs a diagonal spread is that you are not trading the same strike price although you are still trading different expiration periods.
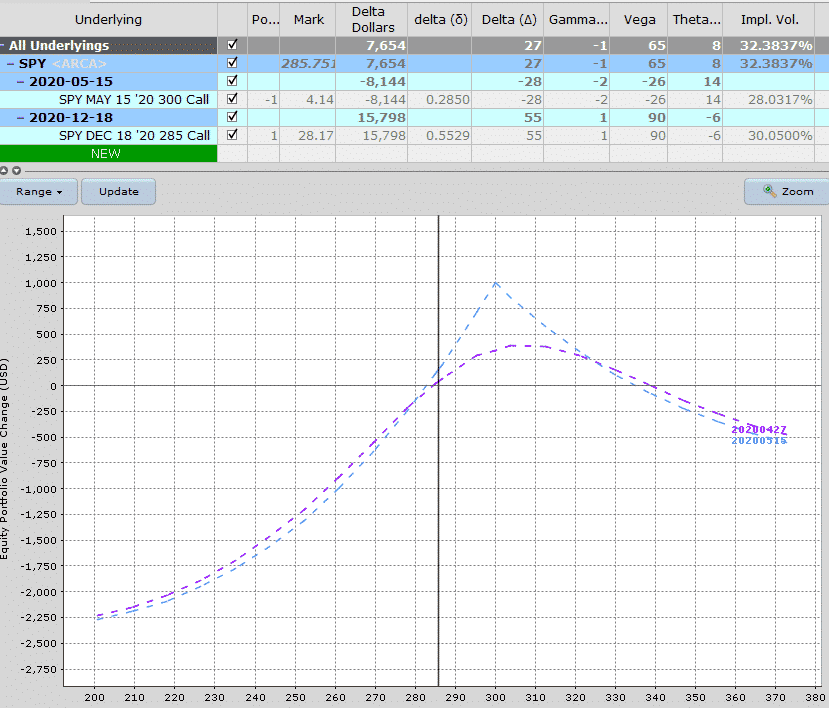
A calendar spread is also a neutral trade, whereas a diagonal spread will have a directional exposure. That could be positive delta or negative delta depending on how the trade is set up.
Looking at the diagonal spread below there is delta of 27 and delta dollars of 7,654. Vega is slightly higher and theta is slightly lower on the diagonal spread vs the calendar spread.
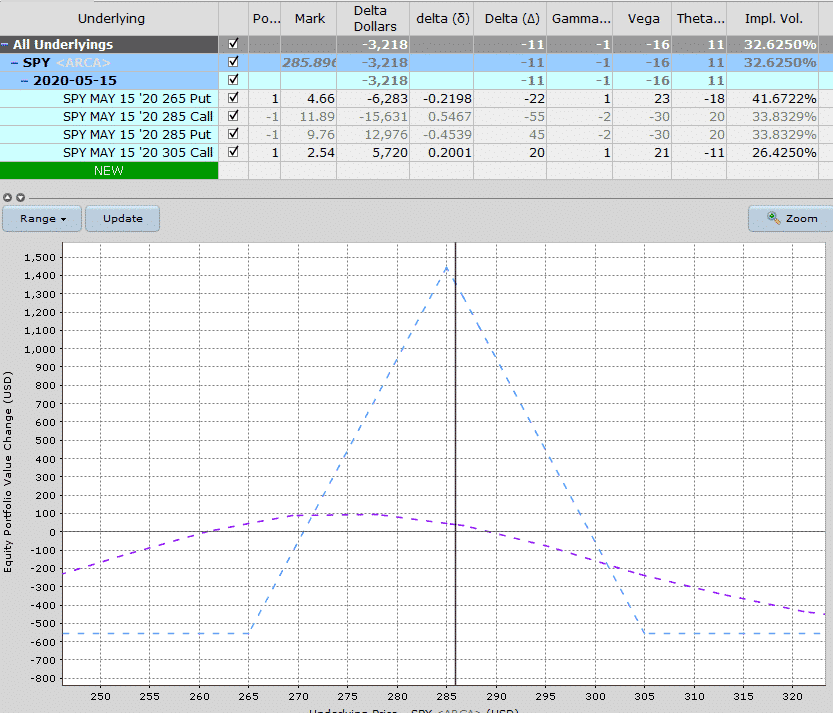
Calendar Spread vs Iron Butterfly
Calendar spreads and butterfly spreads have quite similar payoff diagrams in that they have the tent shape, but there are slight differences.
The main difference between the two is that butterflies (whether using calls, puts or both) use options in the same expiration period.
For this reason, the maximum gain for a butterfly spread is always known in advance, whereas it’s not possible to know for a calendar spread because of the potential variation in implied volatility.
A couple of other things to notice when comparing the calendar spread vs the iron butterfly:
1. The profit potential is much higher on the iron butterfly
2. The breakeven points are slightly closer in for the butterfly
3. Even though the iron butterfly is at-the-money, it has slightly negative delta
4. The calendar spread is positive vega while the iron butterfly is negative vega
Calendar Spread vs Short Straddle
Calendar spreads and short straddles also have the tent shaped profit zone but like a butterfly, the main difference is that the short straddle uses options in the same expiration period.
A short straddle is effectively a butterfly spread without the protection of the wings.
Calendar spreads are considered lower risk than a short straddle because the losses are limited to the premium paid for the spread whereas a short straddle has potentially unlimited losses.
A couple of other points to note comparing the calendar spread vs the short straddle:
1. The profit potential on the calendar spread is lower than the short straddle.
2. The breakeven points are further out for the short straddle
3. The short straddle has slightly negative delta
4. Calendar spreads are also positive vega whereas a short straddle is negative vega
Trade Management
Just like I said in my Ultimate Guide To Bear Call Spreads article, I could spend an entire month talking about trade management for calendar spreads, but let’s at least look at some of the basics here.
As with all trading strategies, it’s important to plan out in advance exactly how you are going to manage the trade in any scenario.
What will you do if the stock rallies? What about if it drops? Where will you take profits? Where and how will you adjust? When will you get stopped out?
Lot’s to consider here but let’s look at some of the basics of how to manage calendar spreads.
PROFIT TARGET
First and foremost, it’s important to have a profit target.
That might be 30% of the potential profit or you may plan on holding to expiration provided the stock stays within the profit tent.
That’s the first decision.
One nice rule of thumb that I use – if I’ve made 50% of the profit potential in less than 50% of the duration of the trade, I take the profit.
So you may want to think about including a time factor in your trading rules.
How long do you plan on holding the trade if neither your profit target or stop loss have been hit?
Another profit taking rule you might consider is – closing when the short call drops to $0.10.
Sometimes the opportunity cost of tying up your margin for the sake of squeezing the last few dollars out of the trade is not worth it.
STOP LOSS
Having a stop loss is also important, perhaps more so than the profit target.
With calendar spreads, you can set a stop loss based on percentage of the capital at risk.
Some traders like to set a stop loss at 20% of capital at risk. Others might set it as 50%.
If your profit target is 50% and your stop loss is 50%, then any success rate greater than 50% will see you come out ahead.
Then it’s just a numbers game and making sure you have enough trades to make sure the statistics play out.
Whatever you decide, make sure it is written down and mapped out in your trading plan.
Short-Term vs Long-Term Calendar Spreads
We talked about this a little bit earlier with the main difference being the cost of the trade.
Long-term trades have high time decay or Theta because the bought option that is further out in time decays at a much slower rate than a shorter-term option.
Longer-term trades have a higher Vega exposure, but that doesn’t necessarily mean that they will be more profitable in the even of a rise in implied volatility because each month on the curve is impacted differently.
Generally speaking a volatility spike will impact shorter-term options much more than longer-term options.
Calendar Spread Examples
Let’s go through a couple of examples of calendar spreads and see how they progressed over the course of the trade.
This trade was on JPM entered on April 1st. We sold the April 24th $85 put for $7.10 and bought the September 18th $85 put for $13.07.
The April 24th puts with only 3 weeks until expiry were very high in value (good to be a seller) given that earnings were set for April 14th.
Remember that when an options falls after an earnings release there is a lot of uncertainty and therefore volatility.
Note that the April puts were trading with implied volatility of 73% compared with IV of 52.5% for the September puts.
That’s a great situation for calendar spreads where you are selling high vol and buying lower vol.
The trade had nice breakevens on the upside and downside.
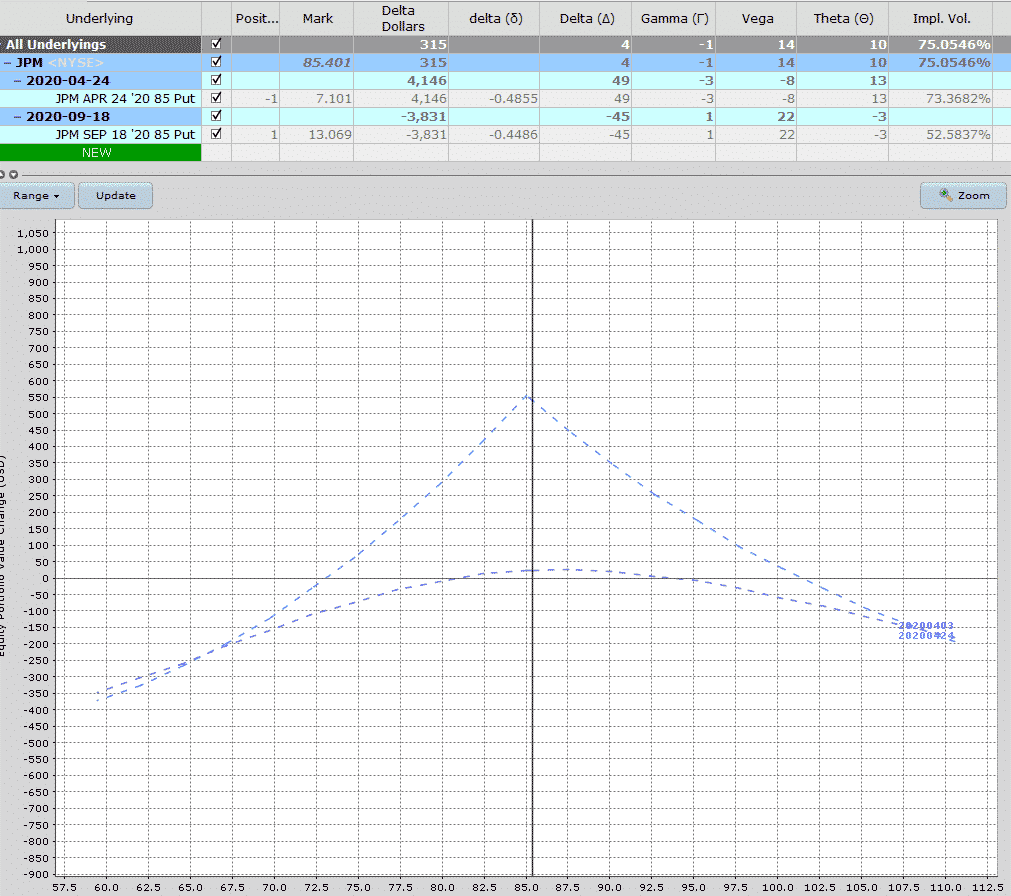
My plan was to close the trade just before earnings no matter what and I ended up getting out when the stock was trading at $102 with a $90 loss.
I didn’t want the risk of holding over earnings as that’s wasn’t part of my trading plan.
But, if I had held on until April 16th when JPM had dropped back to $91, the trade would have been in the black to the tune of $250.
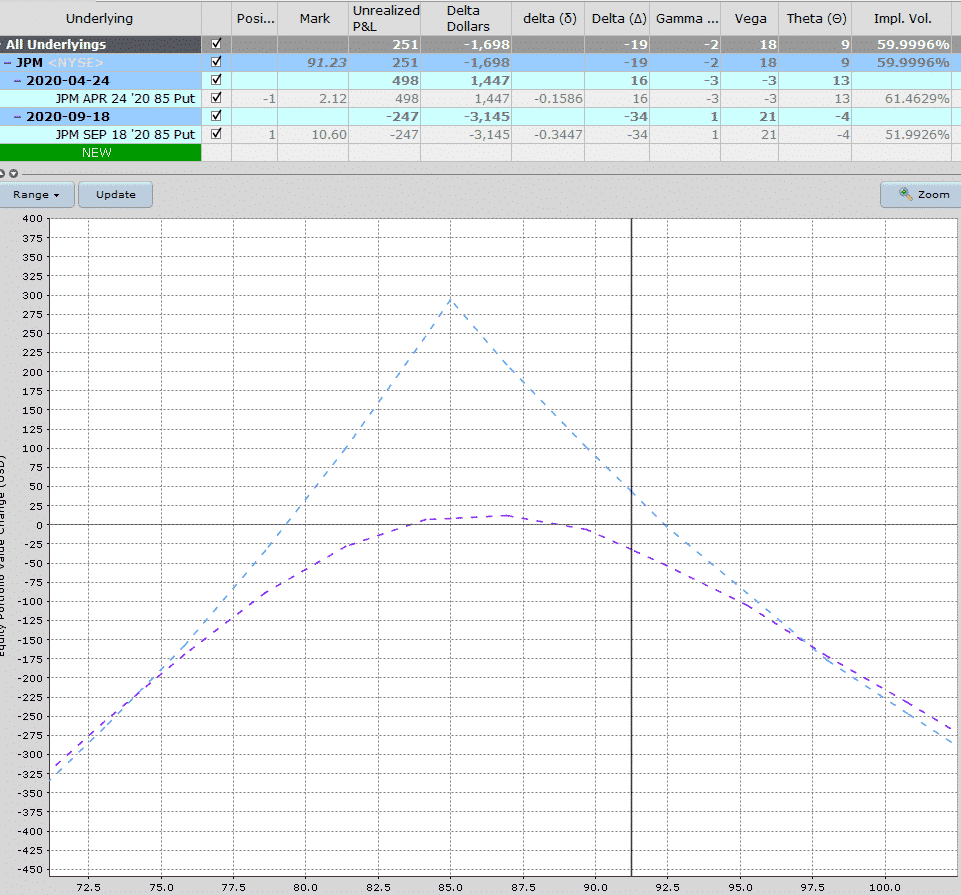
An important thing to notice here is that the front month volatility dropped after earnings from 73% to 61% while the back-month volatility stayed pretty steady and only dropped from 52.5% to 51.99%.
That’s the beauty of calendar spreads!
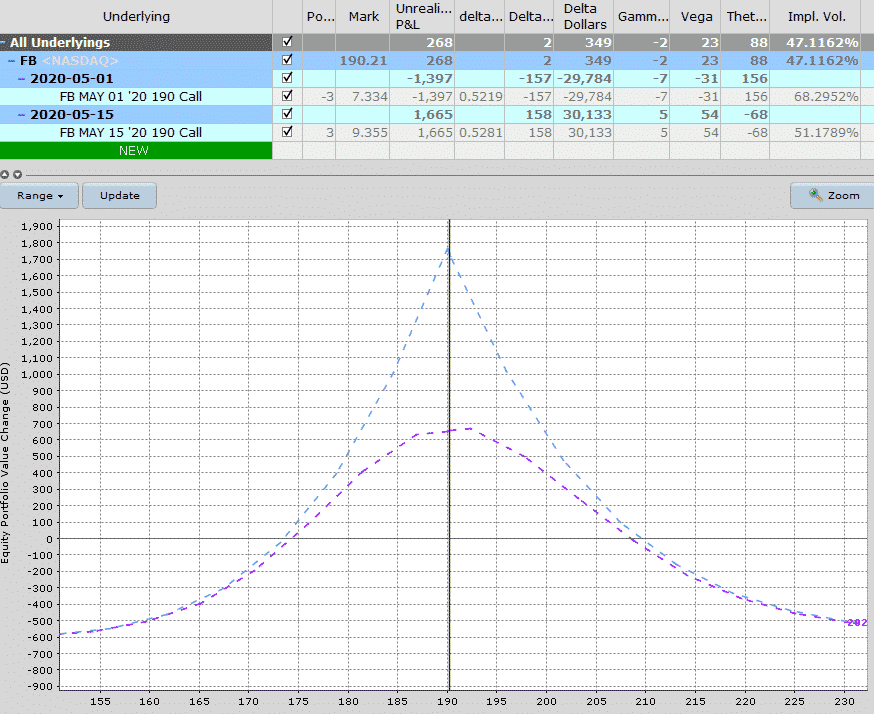
The next example is a FB bullish calendar spread entered on April 15th.
At the time, FB was trading at $175.71.
The chart looked bullish and was showing high levels of accumulation.
The thesis with the trade was that FB was likely to push higher and I had a profit target of $190.
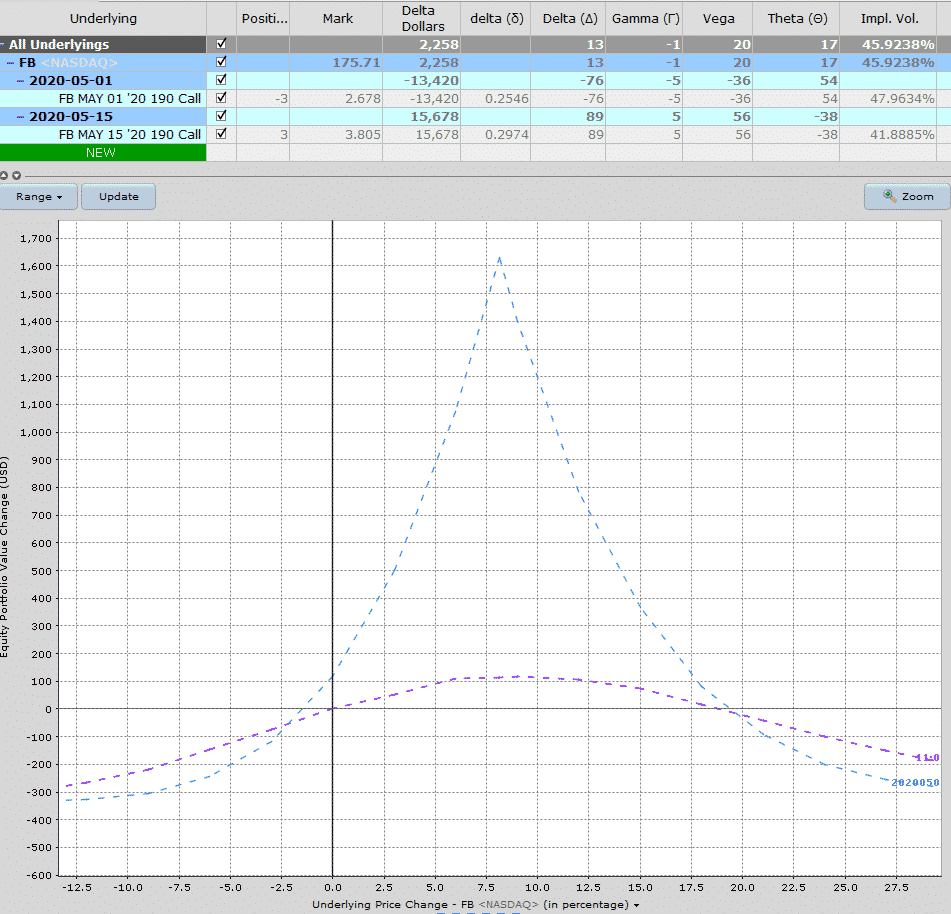
Sure enough, by April 24th, FB hit $190 right on the spot and the calendar spread was showing a profit of $268 which was a 79% return on the initial risk of $338.
Summary
Calendar spreads are a neutral trade that make a nice addition to any option income trader’s portfolio.
The nice thing about them is that that are fairly low risk (unlike short straddles) and they have another benefit of being long vega.
Given that the position contains options across multiple expiration dates, it’s important to have a solid grasp of implied volatility including how volatility changes impact options with different expiration periods.
Calendar spreads have less risk but also less profit potential when compared with short straddles and are also positive vega rather than negative vega.
Disclaimer: The information above is for educational purposes only and should not be treated as investment advice. The strategy presented would not be suitable for investors who are ...
more

