
On Tuesday, we published Fed Rate Cuts – A Signal To Sell Stocks And Buy Bonds? The article presents a historical context for what investors can expect when the Fed cuts rates. Unlike the bullish sentiment prevailing around rate cuts, historical reality has not been so friendly to equity investors.
So what can we expect?
Given that historical perspective, it certainly seems apparent that investors should NOT anticipate a Fed rate-cutting cycle. There are several reasons why: 1- Rate cuts generally coincide with the Fed working to counter a deflationary economic cycle or financial event. 2- As deflationary or financial events unfold, consumer activity contracts, which impairs corporate earnings. 3- As corporate earnings decline, markets must reprice current valuations for lower earnings.
The article ends as follows:
Therefore, as we approach the first Fed rate cut in September, it may be time to consider reducing equity risk and increasing exposure to Treasury bonds.
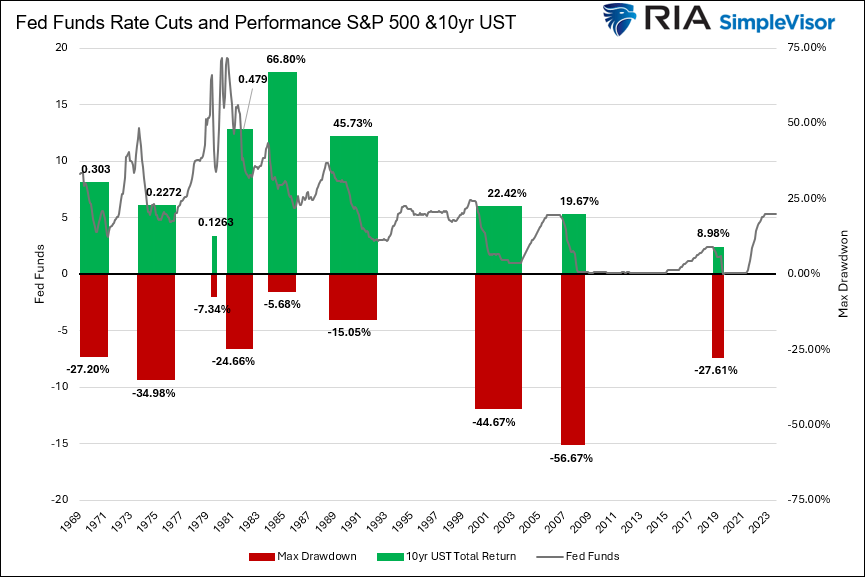
We enhanced an important graph from the article to help answer the question- what can we expect? The original graph showed the maximum drawdowns of stocks during periods of Fed rate cuts. The graph below shows the total return of ten-year UST notes during the entire rate-cutting time frame alongside the equity drawdowns. While history doesn’t always repeat itself, an investor would have been much better off in bonds versus stocks during each of the last nine significant Fed Fund rate cuts. This time may differ, but history is not on your side.
What To Watch Today
Earnings
Economy
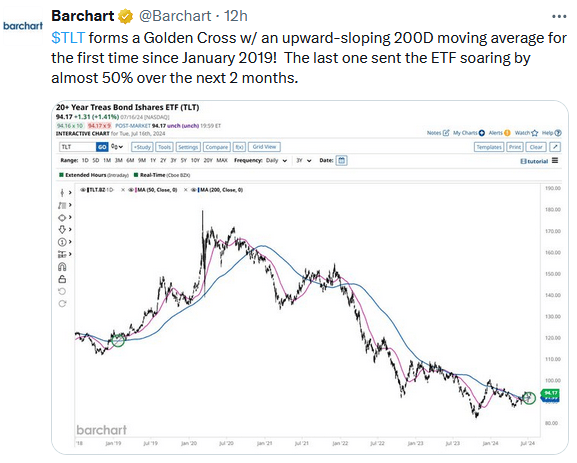
Market Trading Update
Yesterday’s commentary discussed the more bullish setup that is forming in the bond market. As Michael notes above, when the Fed cuts rates, bonds have performed much better than stocks on average.
Each week in the BullBearReport, we publish a Risk-Range report that examines the current price movement of major sectors and markets relative to their historical monthly norms. As shown below, many sectors and markets are currently trading well above those norms.
In particular, the S&P 500, Communications, Technology, Small Cap, Gold, and Gold Miners are trading above normal historical monthly ranges and sport double-digit deviations from their long-term moving averages. These double-digit deviations are not sustainable and will eventually lead to a correction or consolidation (like what technology is currently going through).
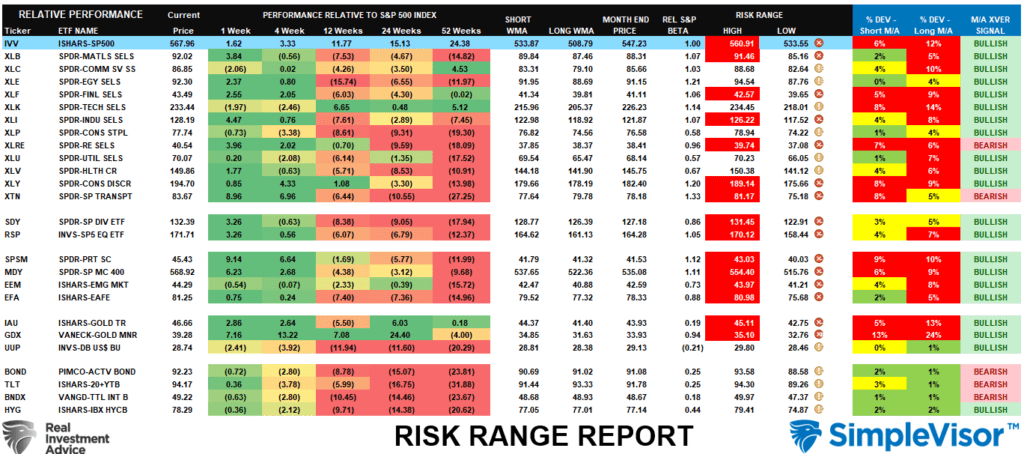
The last time I wrote about these double-digit deviations, it was concerning Gold and Gold miners, which were near the peak in mid-April. From that point, gold traded sideways and lower through mid-June before working off that condition. That extreme has now returned.
This analysis does not suggest that a major correction will occur. However, it is good for understanding when to take profits and reduce portfolio risk. That analysis suggests we are once again near that point.
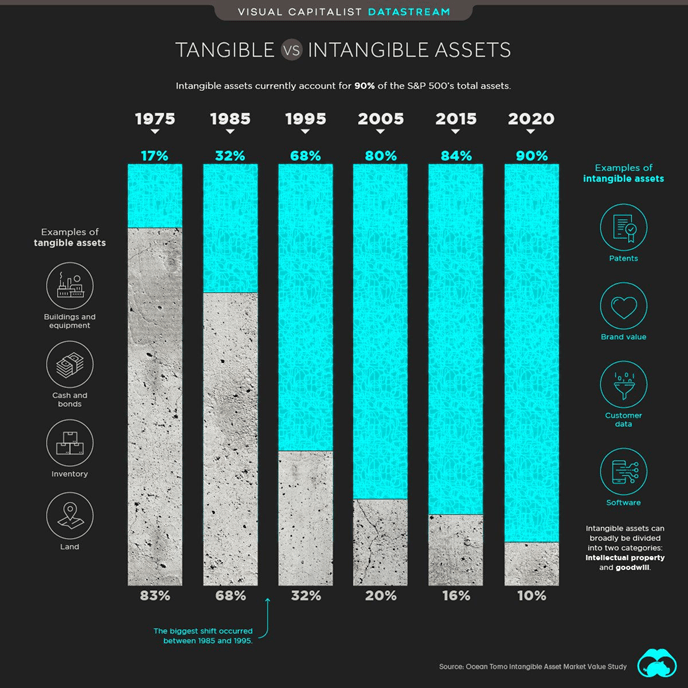
Tangible Vs. Intangible Assets
The graph below, courtesy of the Visual Capitalist, speaks volumes about how the US economy and the S&P 500 have changed over the last 50 years. In the 1970s, the energy, industrial, and automotive sectors were the drivers of the economy. However, over time, it has shifted considerably from the manufacturing sector to the service sector. In 1975, only 17% of assets on corporate balance sheets were intangible. These included things like patents and goodwill. Today, those intangible assets, including customer data and software, account for 90% of corporate assets.
As this shift occurred, the traditional manufacturing industries fell in importance to the S&P 500. At the same time, technology and communications gained significant ground. Utilities, for instance, have an aggregate market cap of approximately $1.70 trillion. Apple is more than double that at $3.60 trillion.
Trump Warns Powell
According to the Financial Times, Donald Trump has told Powell not to cut interest rates before the election. If he obeys, Trump will let Powell serve his full term. Per Trump:
I would let him serve it out. Especially if I thought he was doing the right thing.
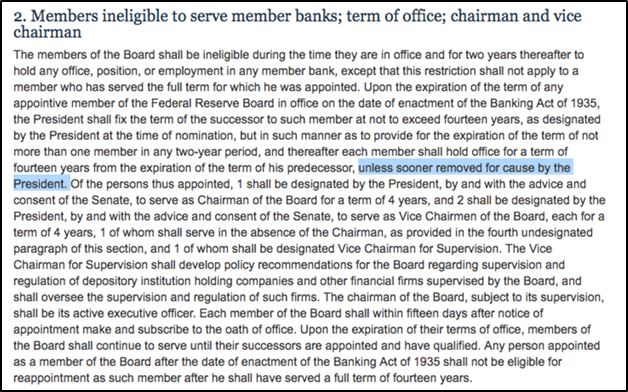
So, if elected, can Trump fire Powell? The answer is yes, but as shown below from the Federal Reserve Act, Trump would need a reason. Given the current state of the economy and slowing inflation, lowering interest rates is not a viable reason to fire Powell. While the election is still months away, we must wait to see if this is another idle threat toward Powell or if it has teeth.
Tweet of the Day
More By This Author:
Goldman Sachs Makes A Case For A July CutThe UM Sentiment Survey Confirms Consumer Jitters
Fed Rate Cuts – A Signal To Sell Stocks And Buy Bonds?


Comments
Log in or sign up to join the conversation.