
VeChain (VETUSD) Elliott Wave Technical Analysis
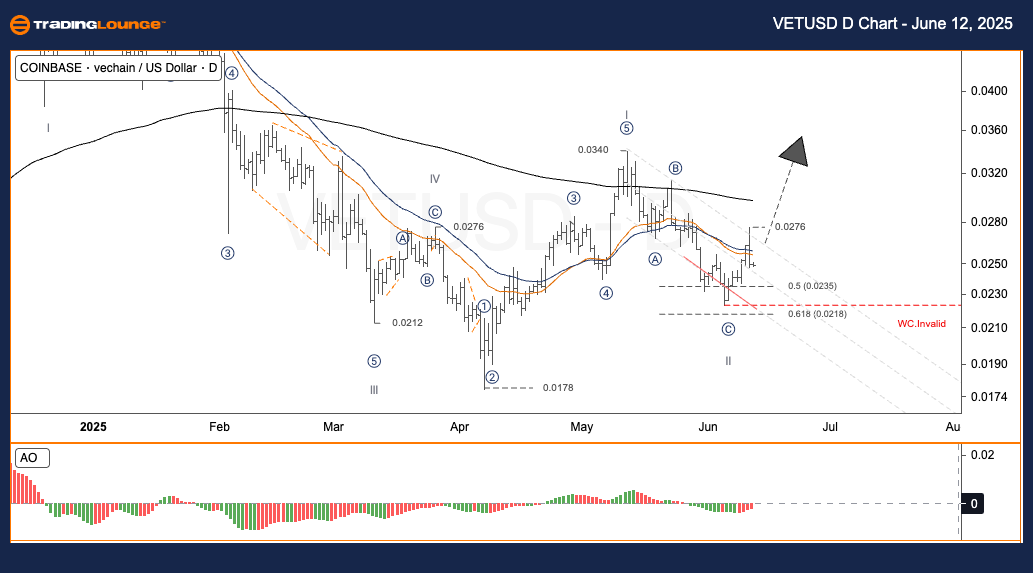
Daily Chart Analysis – TradingLounge
- Function: Follow Trend
- Mode: Motive
- Structure: Impulse
- Wave Position: Wave II
- Wave Cancel (Invalidation) Level: Not specified
Market Overview:
Following a completed corrective pattern labeled ABC, VETUSD entered a strong upward phase, finishing wave (1). The price is now likely to enter wave (2), typically seen as an ABC retracement. This phase can serve as a consolidation before the next bullish trend begins.
Trading Strategy – VETUSD
- Short-Term Approach (Swing Trade):
-
- Wait for price movement into the wave (2) zone.
- Look for a valid entry signal or pattern before buying.
- Risk Management:
-
- Stop-loss should be set below $0.02220 to manage risk effectively.
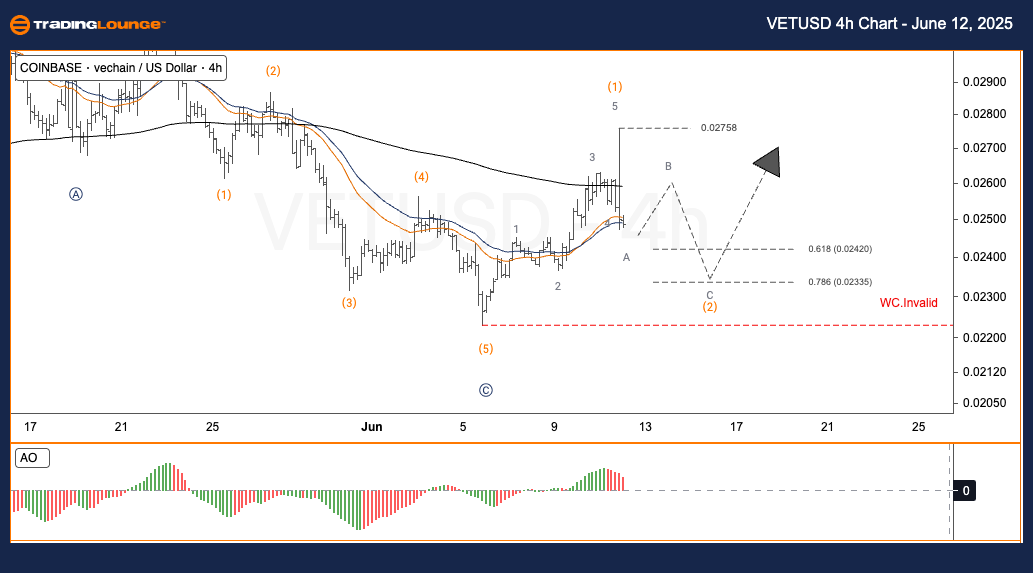
4-Hour Chart Analysis – TradingLounge
- Function: Follow Trend
- Mode: Motive
- Structure: Impulse
- Wave Position: Wave II
- Wave Cancel (Invalidation) Level: Not specified
Short-Term View:
The recent market activity reflects the same wave progression seen in the daily chart. Wave (1) has completed, and wave (2) is forming. Traders should be cautious and wait for a pullback confirmation before entering a position.
Trading Strategy – 4H Chart
- Swing Trade Setup:
-
- Watch for a corrective pullback into the wave (2) region.
- Enter trades only after validation through price structure.
- Risk Strategy:
-
- Suggested stop-loss level: below $0.02220
Analyst: Kittiampon Somboonsod, CEWA
More By This Author:
Palo Alto Networks Inc. U.S. Stocks Elliott Wave Technical Analysis
S&P BSE Sensex Next 50 Index Wave Technical Analysis
Technical Analysis: Euro/U.S. Dollar


Comments
Log in or sign up to join the conversation.