

Image Source: Unsplash
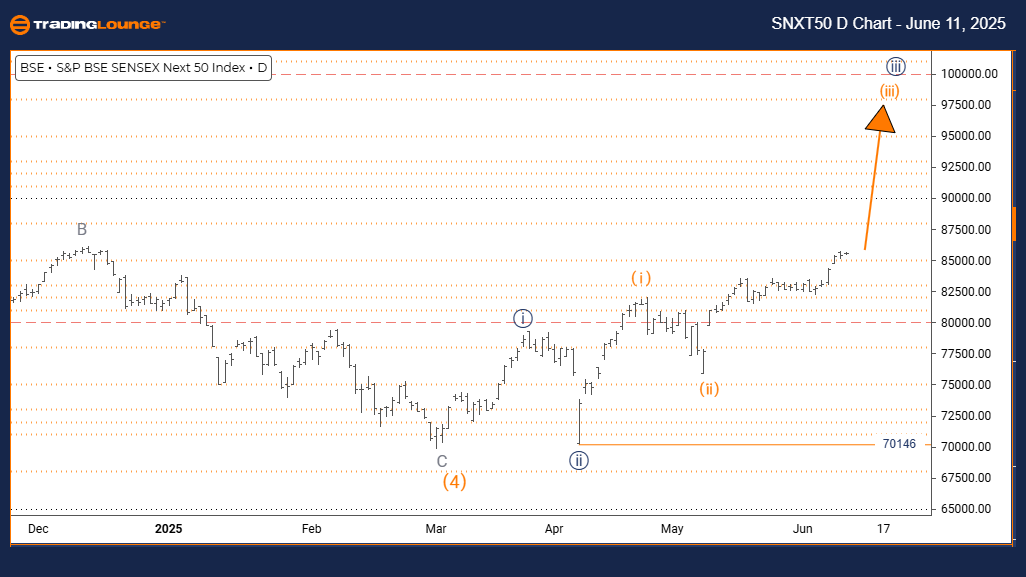
S&P BSE SENSEX NEXT 50 Elliott Wave Analysis – TradingLounge Day Chart
S&P BSE SENSEX NEXT 50 Wave Technical Analysis
- FUNCTION: Bullish Trend
- MODE: Impulsive
- STRUCTURE: Orange Wave 3
- POSITION: Navy Blue Wave 3
- DIRECTION NEXT HIGHER DEGREES: Orange Wave 3 (Started)
- DETAILS: Orange Wave 2 appears completed, and Orange Wave 3 is now active.
- Wave Cancel Invalid Level: 70146
The S&P BSE SENSEX NEXT 50 daily chart Elliott Wave analysis indicates a bullish market setup, with price action in impulsive mode—signaling strong upside momentum. The current wave structure is Orange Wave 3, part of a broader move labeled as Navy Blue Wave 3. This positioning reflects a strong advancing phase within a larger bullish trend.
Orange Wave 2 appears to have finalized its corrective pattern, with the transition into Orange Wave 3 now underway. This wave is typically the most dynamic and extended within the Elliott Wave structure, often resulting in aggressive price surges. Orange Wave 3 has just initiated based on the current wave count.
A critical invalidation level to monitor is 70146. If the index falls below this point, the wave structure would be invalidated and require reassessment. As long as prices remain above this level, the bullish outlook remains valid. The impulsive nature of the current setup indicates strong buying activity and the potential for significant gains as Orange Wave 3 progresses.
(Click on image to enlarge)
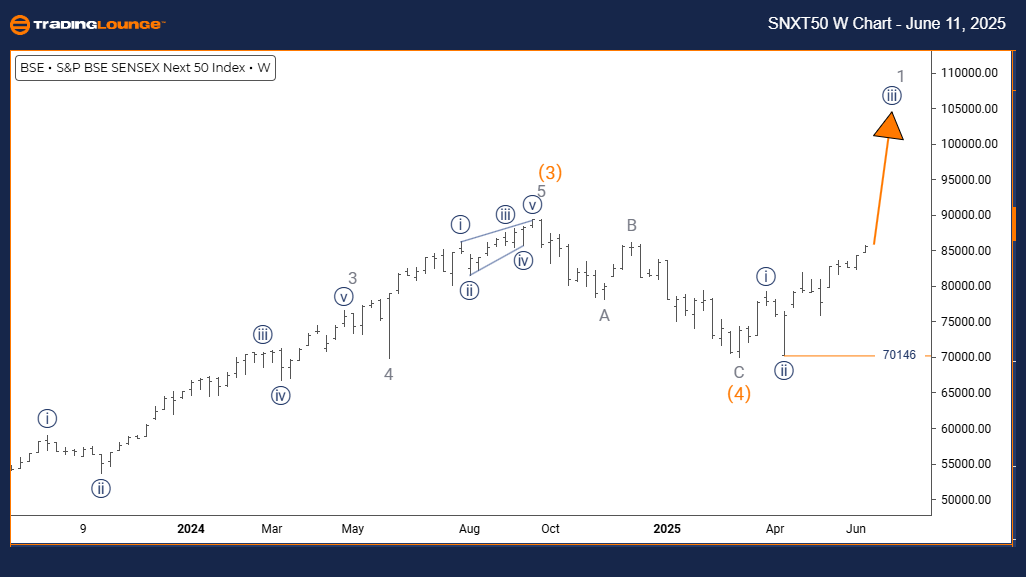
S&P BSE SENSEX NEXT 50 Elliott Wave Analysis – TradingLounge Weekly Chart
S&P BSE SENSEX NEXT 50 Wave Technical Analysis
- FUNCTION: Bullish Trend
- MODE: Impulsive
- STRUCTURE: Navy Blue Wave 3
- POSITION: Navy Blue Wave 3
- DIRECTION NEXT HIGHER DEGREES: Navy Blue Wave 3 (Started)
- DETAILS: Navy Blue Wave 2 appears completed, and Navy Blue Wave 3 is now in play.
- Wave Cancel Invalid Level: 70146
The S&P BSE SENSEX NEXT 50 weekly chart Elliott Wave analysis confirms a bullish outlook, supported by impulsive price action. The current wave structure is Navy Blue Wave 3, one of the strongest stages in an Elliott Wave cycle, suggesting high potential for extended gains.
The completion of Navy Blue Wave 2 marks a transition into Navy Blue Wave 3, which typically exhibits powerful directional moves. The structure is still evolving, and traders should monitor the wave’s internal development as it follows its projected bullish trajectory.
The wave cancel invalidation level is set at 70146. A drop below this mark would nullify the current wave count and require a revised analysis. Until then, the current configuration supports continued strength and potential upward breakout as the third wave progresses.
(Click on image to enlarge)
More By This Author:
Unlocking ASX Trading Success: Northern Star Resources Ltd - Tuesday, June 10
Elliott Wave Technical Analysis: Hang Seng Index - Tuesday, June 10
Elliott Wave Technical Analysis: Euro/British Pound - Tuesday, June 10


Comments
Log in or sign up to join the conversation.