
EURGBP Elliott Wave Analysis
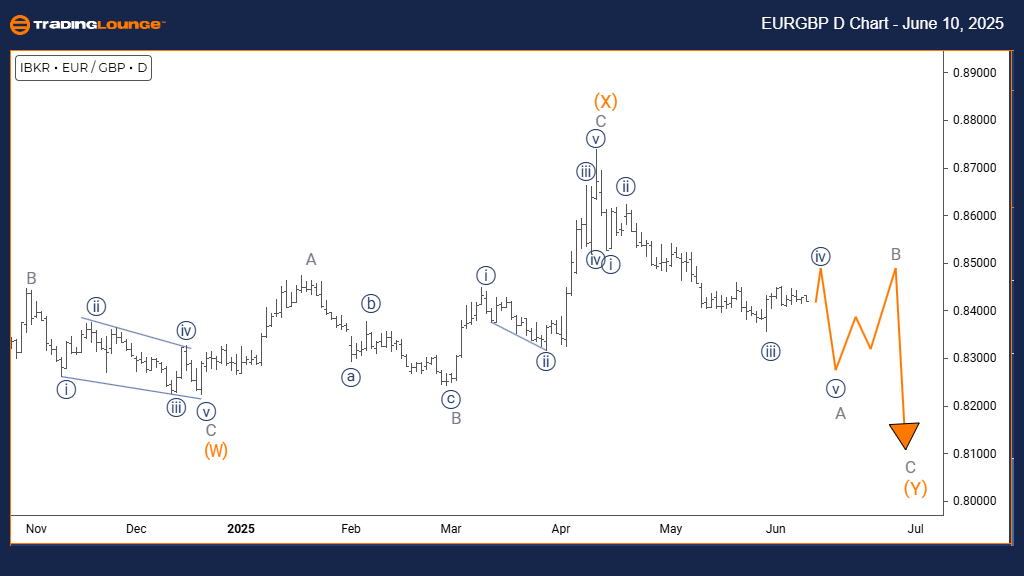
Euro/British Pound (EURGBP) Day Chart
EURGBP Elliott Wave Technical Analysis
FUNCTION: Counter Trend
MODE: Impulsive
STRUCTURE: Gray Wave A
POSITION: Orange Wave Y
DIRECTION NEXT HIGHER DEGREES: Gray Wave B
DETAILS: Orange Wave X appears complete, and Gray Wave A of Orange Wave Y is now unfolding.
The daily Elliott Wave analysis for EURGBP outlines a counter-trend setup with impulsive price action, signaling a strong move against the prevailing trend. The current structure is defined as Gray Wave A, developing within a broader corrective framework labeled Orange Wave Y. This configuration indicates that the pair is in the early stages of a significant counter-trend correction.
According to the analysis, Orange Wave X has likely completed, transitioning into Gray Wave A of Orange Wave Y. This move marks the beginning of a new corrective sequence that might develop as a zigzag or similar corrective structure. The next higher-degree movement expected is Gray Wave B, which would likely retrace a portion of Gray Wave A’s gains upon completion.
The impulsive qualities of Gray Wave A imply that this counter-trend leg could have strong momentum before the corrective Gray Wave B begins. EURGBP is currently positioned in the early phase of Orange Wave Y, with Gray Wave A actively progressing after Orange Wave X.
Traders should monitor for signals that Gray Wave A is ending, which would precede the anticipated retracement in Gray Wave B. The characteristics of this impulsive wave suggest that the pair may experience noticeable price shifts during this stage. Spotting the end of Gray Wave A will be key to preparing for the likely corrective movement of Gray Wave B within the larger Orange Wave Y pattern.
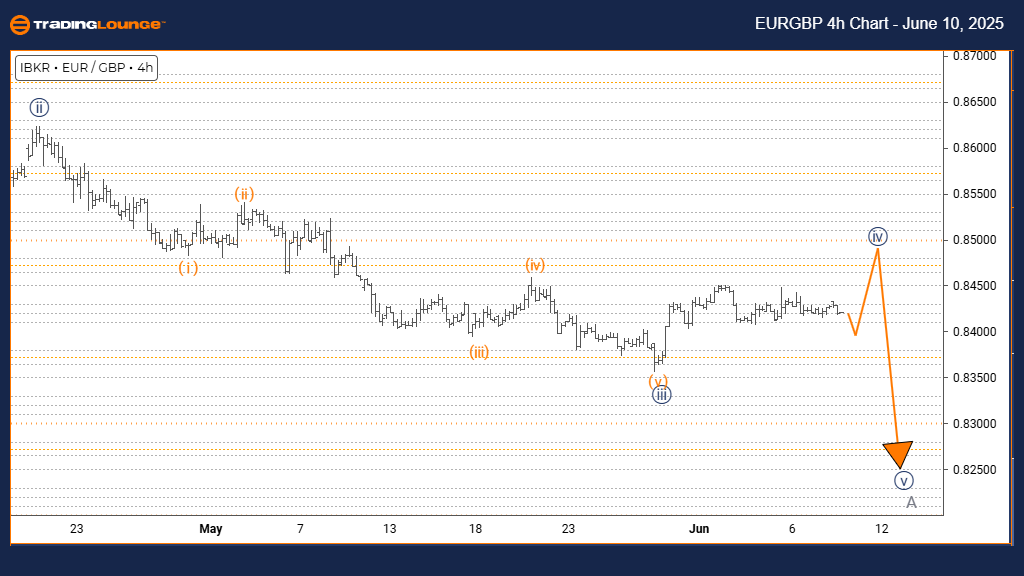
Euro/British Pound (EURGBP) 4 Hour Chart
EURGBP Elliott Wave Technical Analysis
FUNCTION: Counter Trend
MODE: Corrective
STRUCTURE: Navy Blue Wave 4
POSITION: Gray Wave A
DIRECTION NEXT LOWER DEGREES: Navy Blue Wave 5
DETAILS: Orange Wave 3 appears complete, with Orange Wave 4 currently developing.
The 4-hour Elliott Wave analysis for EURGBP reflects a counter-trend setup within a corrective phase, suggesting this is a pause in a larger market movement. The structure is defined as Navy Blue Wave 4, unfolding within Gray Wave A. This positioning implies a short-term retracement or consolidation within the broader correction.
Orange Wave 3 appears to have finished, and the transition into Orange Wave 4 marks a temporary correction within the wave structure. The expected next move at the lower degrees is Navy Blue Wave 5, which would begin once Navy Blue Wave 4 completes, potentially continuing the previous directional trend.
The current configuration places EURGBP in Orange Wave 4, following the end of Orange Wave 3. The corrective nature of this move suggests price action could be range-bound or slightly retrace before the trend resumes. Its placement within Gray Wave A confirms it is part of an initial correction.
Traders are encouraged to monitor Orange Wave 4 for signs of completion. This will signal the likely emergence of Navy Blue Wave 5, possibly representing a resumption of the broader trend. The temporary corrective pattern may present mild retracement or sideways movements in the short term for EURGBP.
Technical Analyst: Malik Awais
More By This Author:
Elliott Wave Technical Analysis: Sei/US Dollar Crypto Price News For Tuesday, June 10
Elliott Wave Technical Analysis: Amazon Inc. US Stocks
Elliott Wave Technical Analysis: Gold - Monday, June 9


Comments
Log in or sign up to join the conversation.