
Image Source: Unsplash

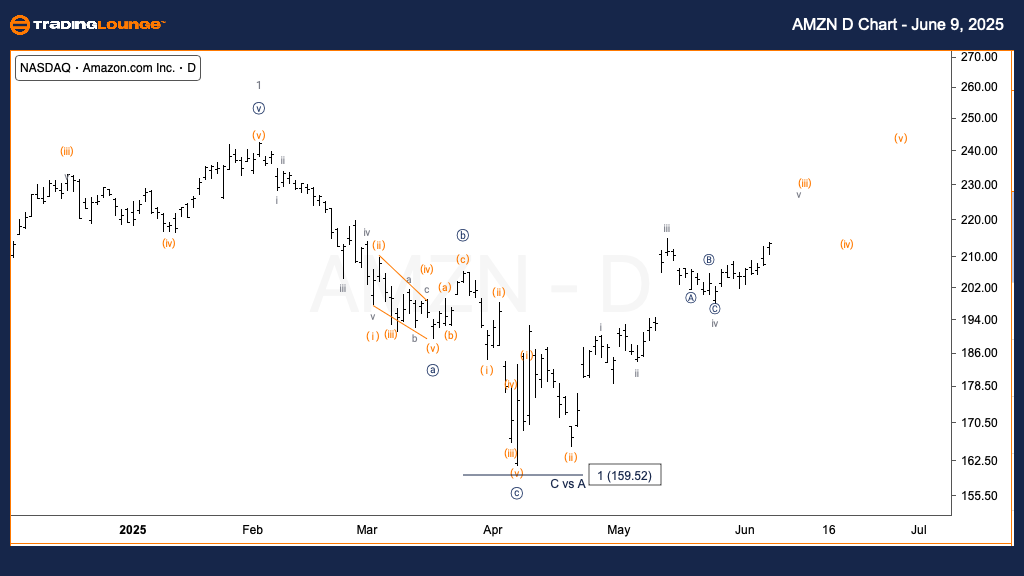
AMZN Elliott Wave Analysis – Trading Lounge Daily Chart, Amazon.com Inc. (AMZN) – Daily Chart
AMZN Elliott Wave Technical Analysis
- Function: Trend
- Mode: Impulsive
- Structure: Motive
- Position: Wave v of (iii)
- Direction: Upward move in wave (iii)
Details:
We expect continued upward movement in Minuette wave (iii). After consolidating for about two weeks near the $200 level (TradingLevel2), AMZN is now targeting the upper boundary of MinorGroup1. This signals the next phase of the upward trend may be underway.
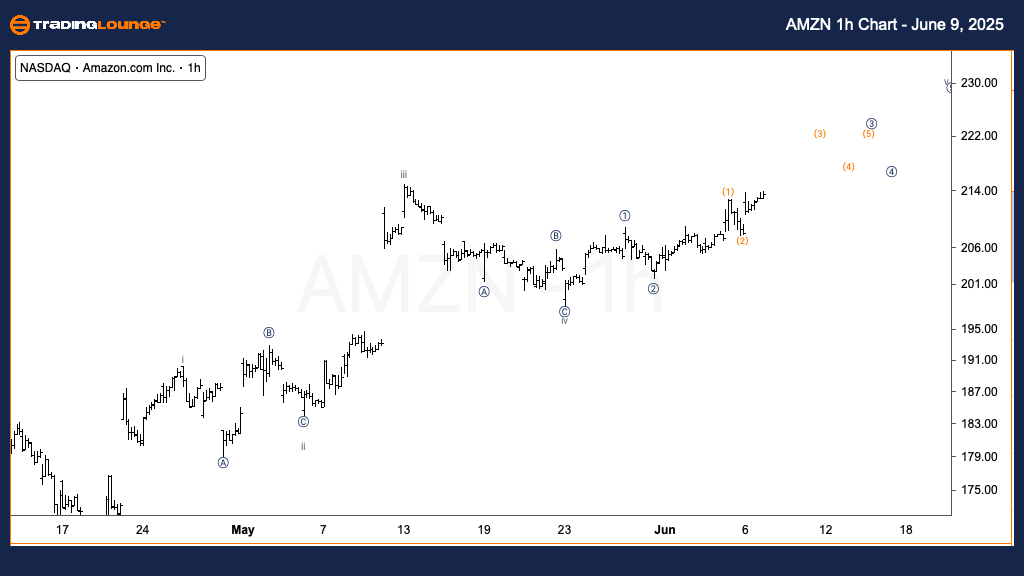
AMZN Elliott Wave Analysis – Trading Lounge 1H Chart, Amazon.com Inc. (AMZN) – 1H Chart
AMZN Elliott Wave Technical Analysis
- Function: Trend
- Mode: Impulsive
- Structure: Motive
- Position: Wave 3 of iii
- Direction: Upward momentum in micro wave 3
Details:
A sharp move is developing into submicro wave 3 of micro wave 3, reinforcing the current bullish trend. The price is gaining momentum, which supports the wave count and suggests further upside potential.
Overview:
This Elliott Wave analysis reviews Amazon.com Inc. (AMZN) using both daily and 1-hour charts to interpret current price action through the lens of Elliott Wave Theory. The larger trend shows strength through Minuette wave (iii), while short-term action confirms the count with accelerating movement in micro waves.
Technical Analyst: Alessio Barretta
Source: TradingLounge.com
More By This Author:
Elliott Wave Technical Forecast - Block, Inc
Elliott Wave Technical Analysis: Gold - Monday, June 9
Polkadot Crypto Price News Today


Comments
Log in or sign up to join the conversation.