

Image Source: Pexels
PANW Elliott Wave Analysis – TradingLounge Daily Chart,
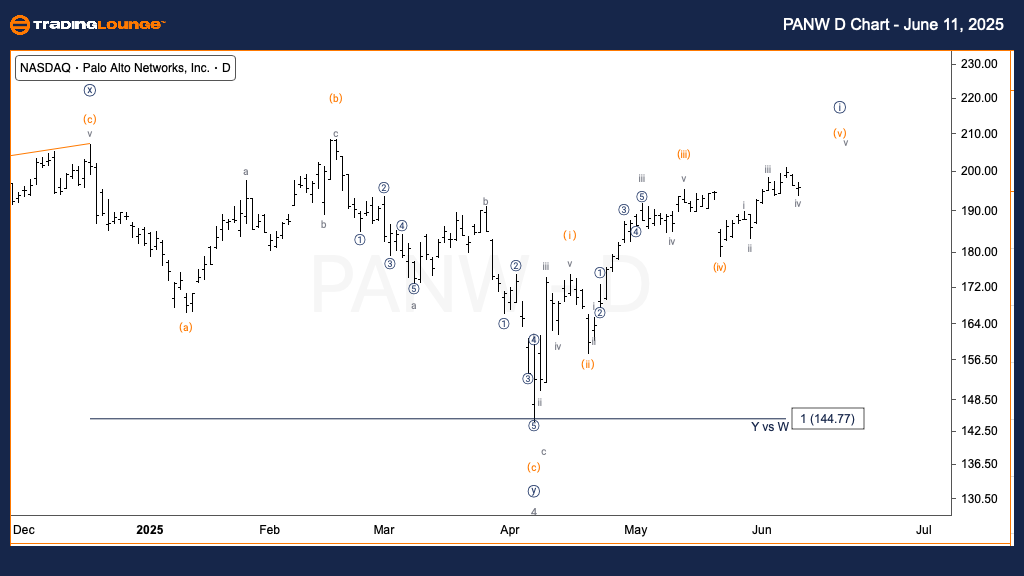
Palo Alto Networks Inc. (PANW) – Daily Chart
PANW Elliott Wave Technical Analysis
- FUNCTION: Trend
- MODE: Motive
- STRUCTURE: Impulsive
- POSITION: Wave (v) of {i}
- DIRECTION: Upside into Wave (v)
- DETAILS: Price action is advancing into Wave (v), approaching a key resistance near Trading Level 2 at $200, a critical and sensitive price zone.
The daily chart for PANW shows continued upward momentum within an impulsive wave structure, targeting the completion of Wave (v) of Minor Wave {i}. The $200 level, corresponding to Trading Level 2, represents a potential resistance zone. A confirmed break above this level may trigger further bullish continuation.
(Click on image to enlarge)
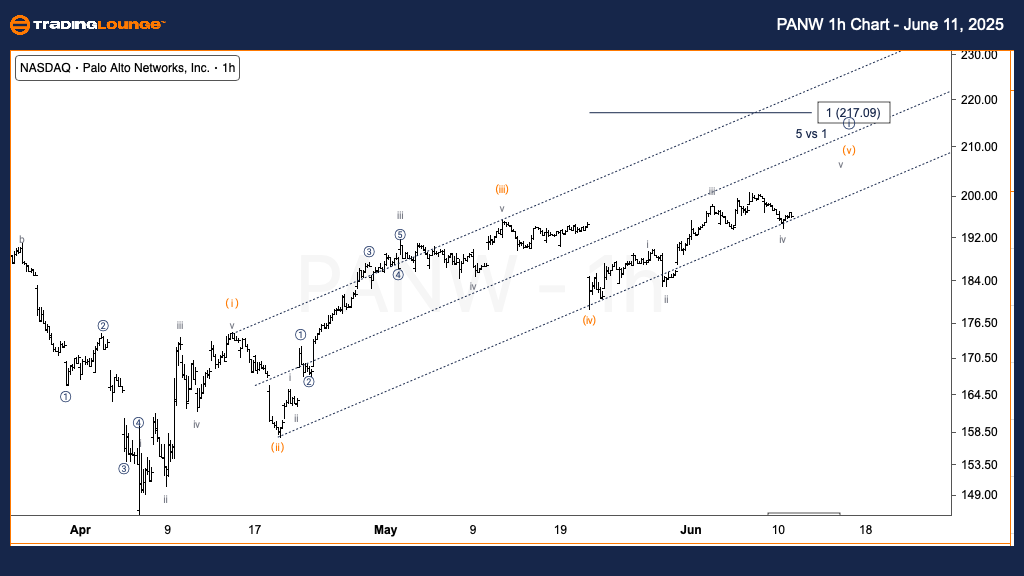
Palo Alto Networks Inc. (PANW) – 1 Hour Chart
PANW Elliott Wave Technical Analysis
- FUNCTION: Trend
- MODE: Motive
- STRUCTURE: Impulsive
- POSITION: Wave v of (v)
- DIRECTION: Upside in Wave v
- DETAILS: Price has found support atop the parallel channel from Wave (iv). We are now advancing in Wave v, with a minimum target of $200. The textbook target where Wave (v) = Wave (i) lies at $217.
The 1H chart confirms bullish structure continuation after a solid retest of the parallel channel support. With Wave (v) progressing, the short-term objective is $200, while $217 remains a logical extension if equality with Wave (i) plays out. Momentum supports a bullish near-term scenario.
(Click on image to enlarge)
More By This Author:
Ripple (XRPUSD) Elliott Wave Technical Analysis
Technical Analysis: Cocoa Commodity
Stock Analysis: Mineral Resources Limited


Comments
Log in or sign up to join the conversation.