Will The Mysterious 17 Year Cycle Continue?
The picture on the stock markets in Europe and the US is an exciting one. But before we discuss the individual charts, a few brief words to explain the following indicators:
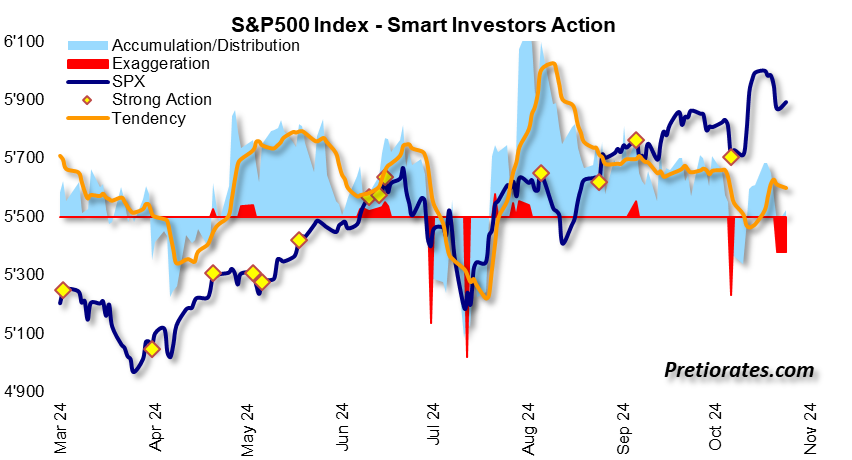
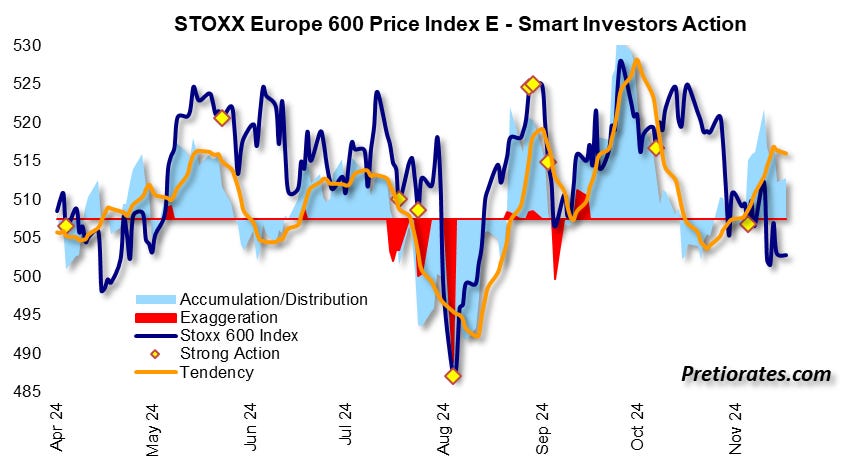
The Smart Investors Action (SIA) shows how the big investors behave in the background. They are responsible for the trend and usually trade over several days. And this is not necessarily recognizable from the absolute movement of an index. The light blue area shows whether they are accumulating or distributing. The orange line shows the corresponding trend. If the area turns red, it is an 'exaggeration' because the volume is well above the average of the last few trading days.
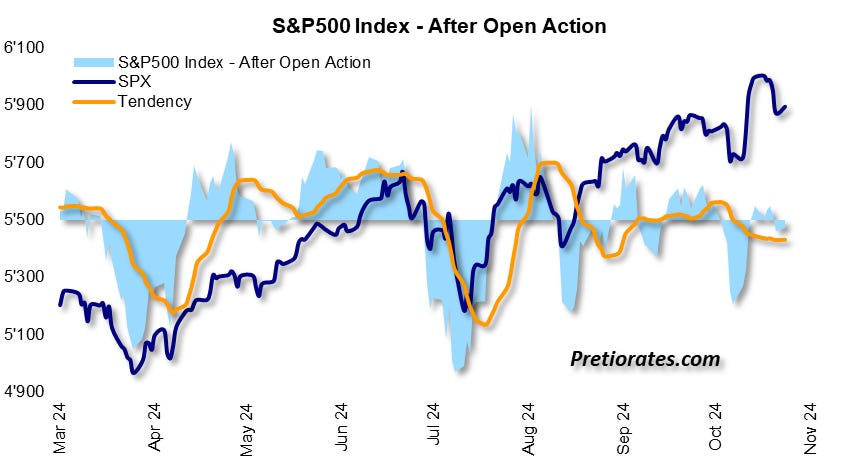
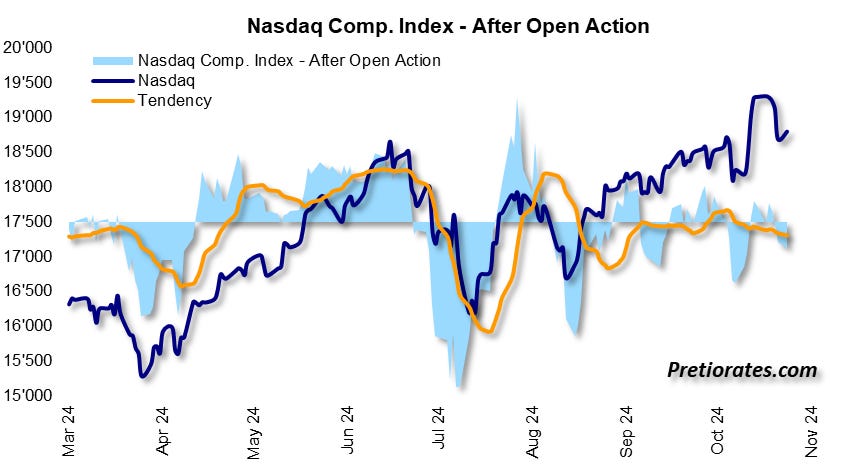
During the opening phase of each trading day, the orders accumulated up to that point are traded. What is interesting, however, is what the usually professional investors do after the opening (not all of them are smart). This is shown by the 'After Open Action' (AoA) indicator.
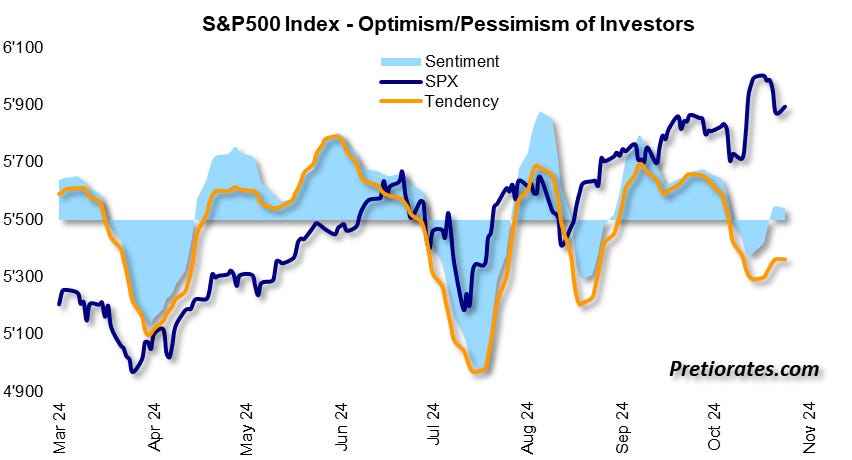
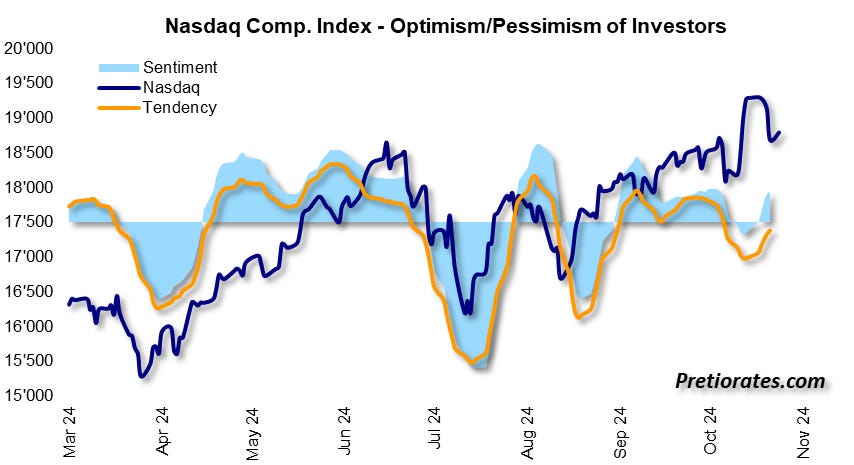
The third indicator shows the sentiment, optimistic or pessimistic (O/P), based on our criticisms. It is important to note that sell-offs are rarely to be expected during optimistic markets. Only when unexpected (negative) surprises occur. Sell-offs almost exclusively only take place during phases when the market is already pessimistic.
Over the last few days, Wall Street digested the advances of the Trump rally. In doing so, an 'exaggeration' immediately became apparent. The profit-taking was therefore carried out with an unusually high volume, but this did not result in a big correction of the index, which would actually have been expected...
(Click on image to enlarge)
The 'After Open Action', on the other hand, was unusually inactive, with no real trend. The sales orders that can be seen in the SIA above were therefore mainly made at the opening – when the euphoric investors were buying like crazy...
(Click on image to enlarge)
The O/P indicator also shows no euphoria, which would actually be expected after the big advances. But market participants do not seem to be pessimistic either – which makes them more resilient to negative developments (see geopolitical developments in Ukraine)…
(Click on image to enlarge)
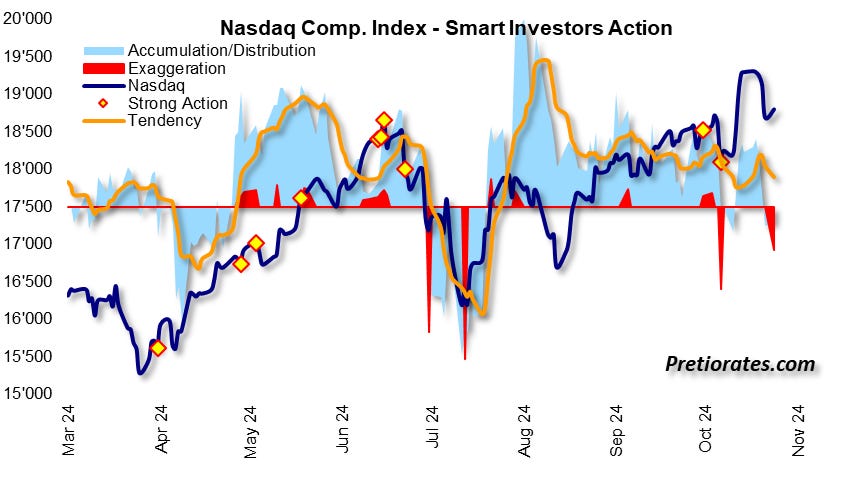
The same picture can be seen in the Nasdaq index: the slight index losses after the strong rally immediately led to an 'exaggeration'... This is usually followed by a countermovement – sometimes even on the same day...
(Click on image to enlarge)
After the opening of the trading sessions in recent days, professional investors have apparently been reluctant to trade here as well...
(Click on image to enlarge)
And the mood is definitely not pessimistic...
(Click on image to enlarge)
A different picture emerges in Europe, which would be particularly affected by an escalation in Ukraine. Despite the losses since the election of Donald Trump (people are afraid of his tax tariffs), the smart investors have tended to accumulate...
(Click on image to enlarge)
Overall, however, investors have also significantly reduced their equity positions after the daily opening phases...
(Click on image to enlarge)
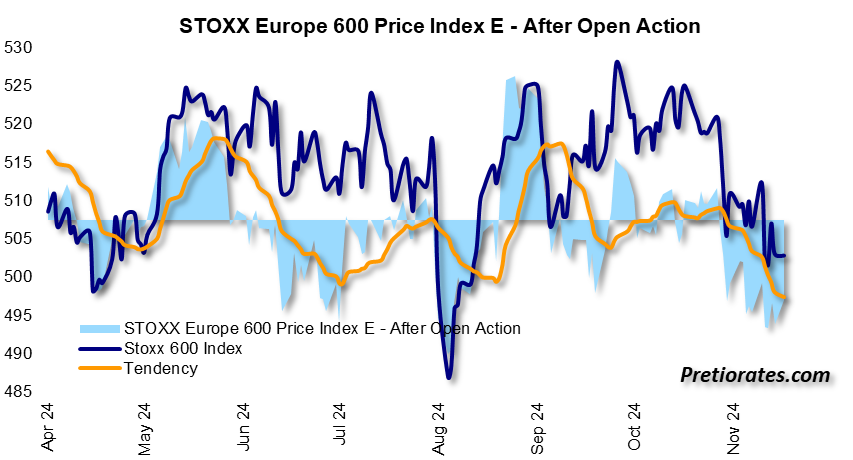
And with that, sentiment also fell definitively into the basement. This could be seen in today's trading: the selling pressure was far stronger than it has been on Wall Street since the opening. Remember: selloffs only really take place when sentiment is already bad...
(Click on image to enlarge)
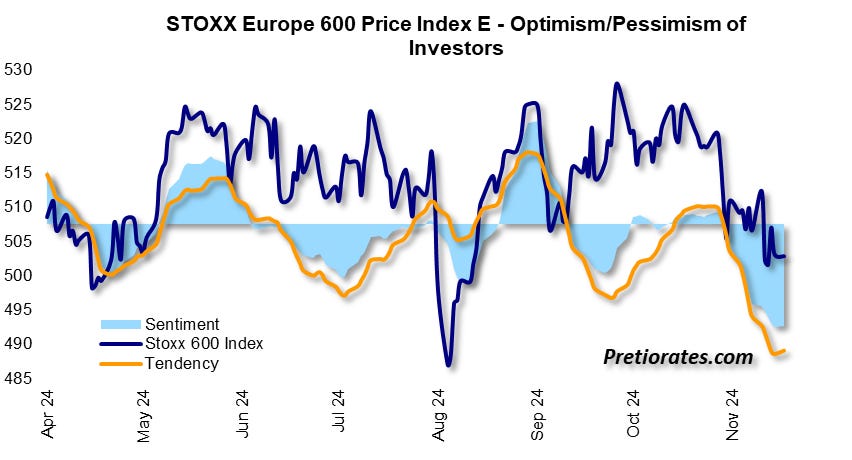
Usually, the pessimistic attitude of European investors would tempt them to buy low so that they can sell higher. Every investor has a 'buy low – sell high' strategy… But the constellation of indicators suggests that investors on Wall Street want to sneak out of it. Sell everything without prices falling too much...
And here we recall the 17-year cycle that cycle specialist Eric Hadik has been discussing in his newsletter 'INSIDE Track Trading' for several years: if this cycle is to continue, there could soon be a correction of at least 20%. It has done so five times in a row since the end of 1938. And since October 2022, we have not seen a 10% or larger pullback in US equities. Such a pullback would therefore be overdue again. But only the future will tell...
(Click on image to enlarge)
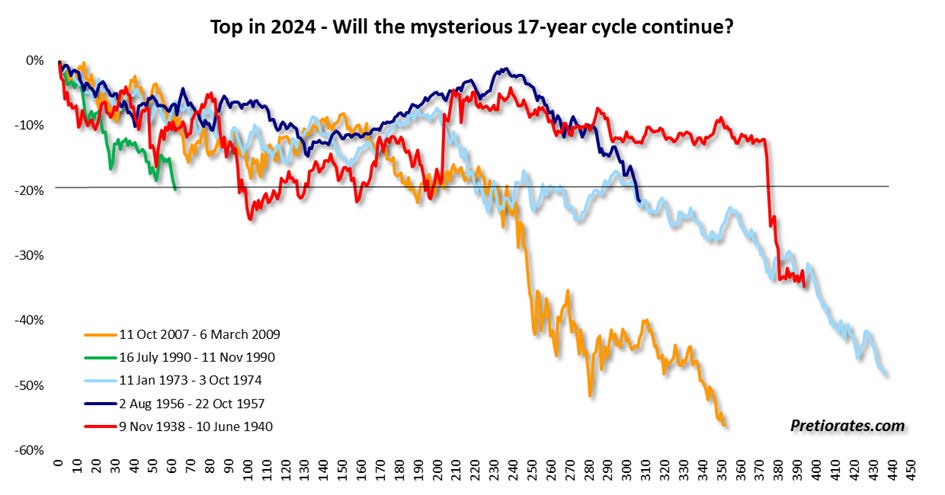
Source: used with permission from INSIIDE Track Trading
More By This Author:
Trading Gold Is Unlike Trading Anything Else
Buy When The Cannons Thunder And Sell When The Angels Sing
Buy When The Cannons Thunder And Sell When The Angels Sing...
Disclaimer: The information & opinions published by Pretiorates.com or "Pretiorates Thoughts" are for information purposes only and do not constitute investment advice. They are solely ...
more


