
The year 2024 may be seen as the time the Bank of Japan’s “free lunch” came to an end. For decades, the Bank of Japan (BoJ) ran a zero interest rate policy (ZIRP) that even descended into negative rates in 2016. The BoJ eased and eased monetary policy (aka printed and printed) to buy Japanese government bonds (JGBs) and all sorts of assets like commercial paper, corporate bonds, exchange traded funds (ETFs), and Japanese Real Estate Investment Trusts (J-REITs). Yet through most of the process, Japan’s inflation rate remained moribund. Japan still enjoys a nearly unresponsive inflation rate, but the Japanese yen, Invesco CurrencyShares® Japanese Yen Trust ETF (FXY), has taken a beating for over 3 years. The yen has lost about a third of its value against the U.S. dollar in this time. The devaluation has planted the Bank of Japan in a currency trap.
Since at least October of last year, various members of Japan’s institutional monetary forces have tried jawboning the yen back to health. The attempt to cash in on free lunch tickets got particularly frantic in the last several weeks with rumors running rampant of an intervention. Headlines and whispers filled with claims of lines in the sane for USD/JPY: 150, 155, 160, 170, maybe even 180? Whatever the reality, currency markets set about testing the BoJs bluster. The trap was set.
The BoJ for months showed reticence, even trepidation, about even hinting at a normalization of policy. Each official announcement reinforced the need for accommodative policy and aggressive monetary easing. With rates relatively high across the developed world and a particularly strong economy in the U.S., selling (or borrowing) yen to buy other currencies is just too attractive. Markets have been free to ignore the BoJ and just keep pressuring the yen lower and lower. The currency trap just deepened.
Last week ended with USD/JPY running up another 1.7%. Soon after the open of Asian trading markets Monday morning, traders went right back to testing the BoJs bluster and stretched the parabolic move to levels last seen in 1990. Soon after punching through 160, the yen finally woke up.
(Click on image to enlarge)
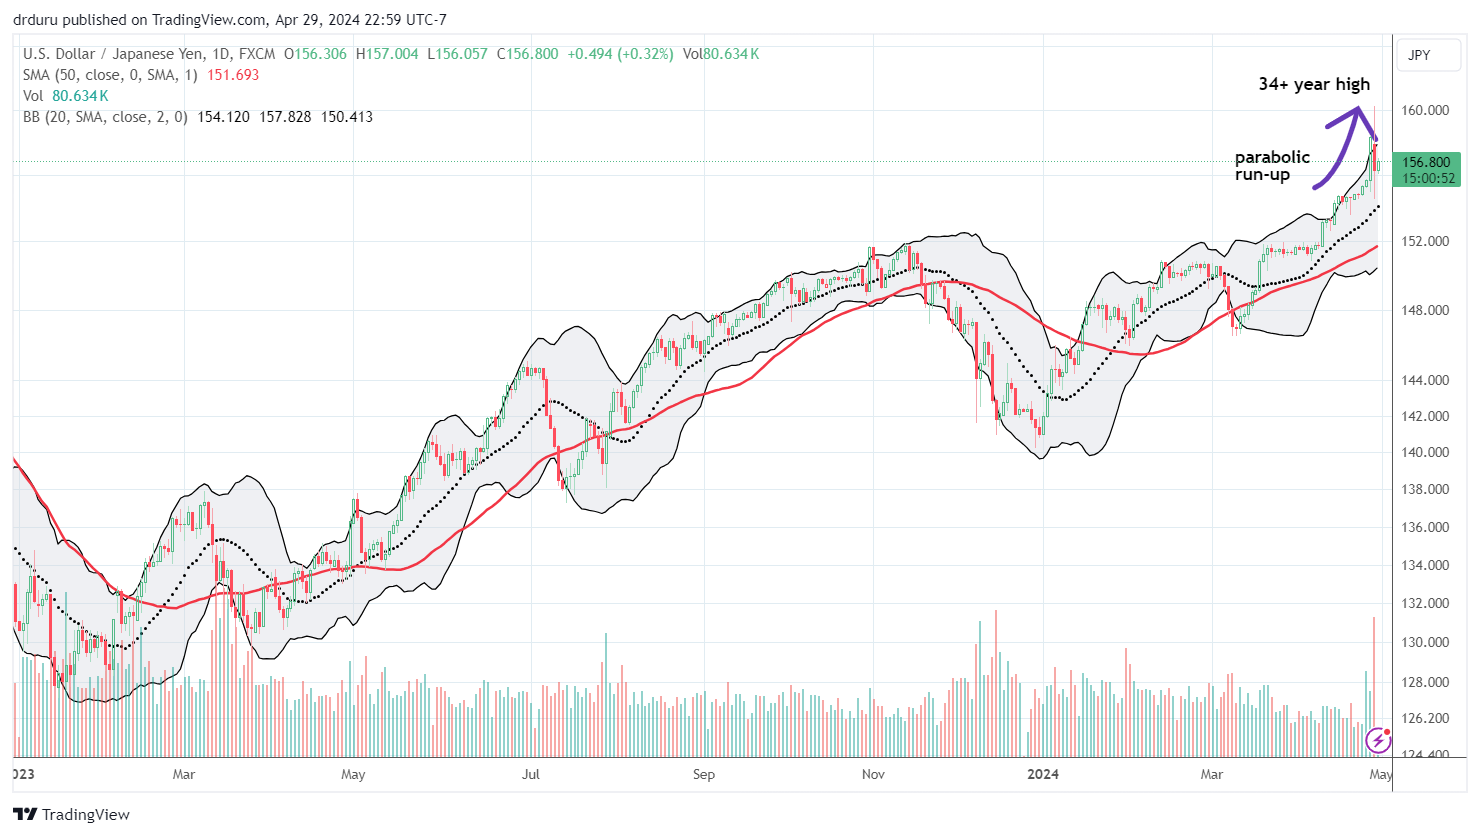
The US dollar versus the Japanese yen (USD/JPY) – a parabolic run-up finally forced a sharp and opposite reaction…but it looks like a pinprick compared to the devaluation to-date.
This volatile trading action is yet one more lesson in the potential hazards of parabolic price surges. They are typically unstable and force an opposite and often equal reaction. In this case, the opposing force is likely the Bank of Japan trying to fight its way out of the currency trap. However, if this action was indeed the result of currency intervention, so far, it looks quite ineffective. USD/JPY did not even reach its uptrending 20-day moving average (DMA) (the dotted line above), before buyers forced the issue on a bottom.
The 15-minute intraday view shows the futility (so far) of the intervention even more clearly.
(Click on image to enlarge)
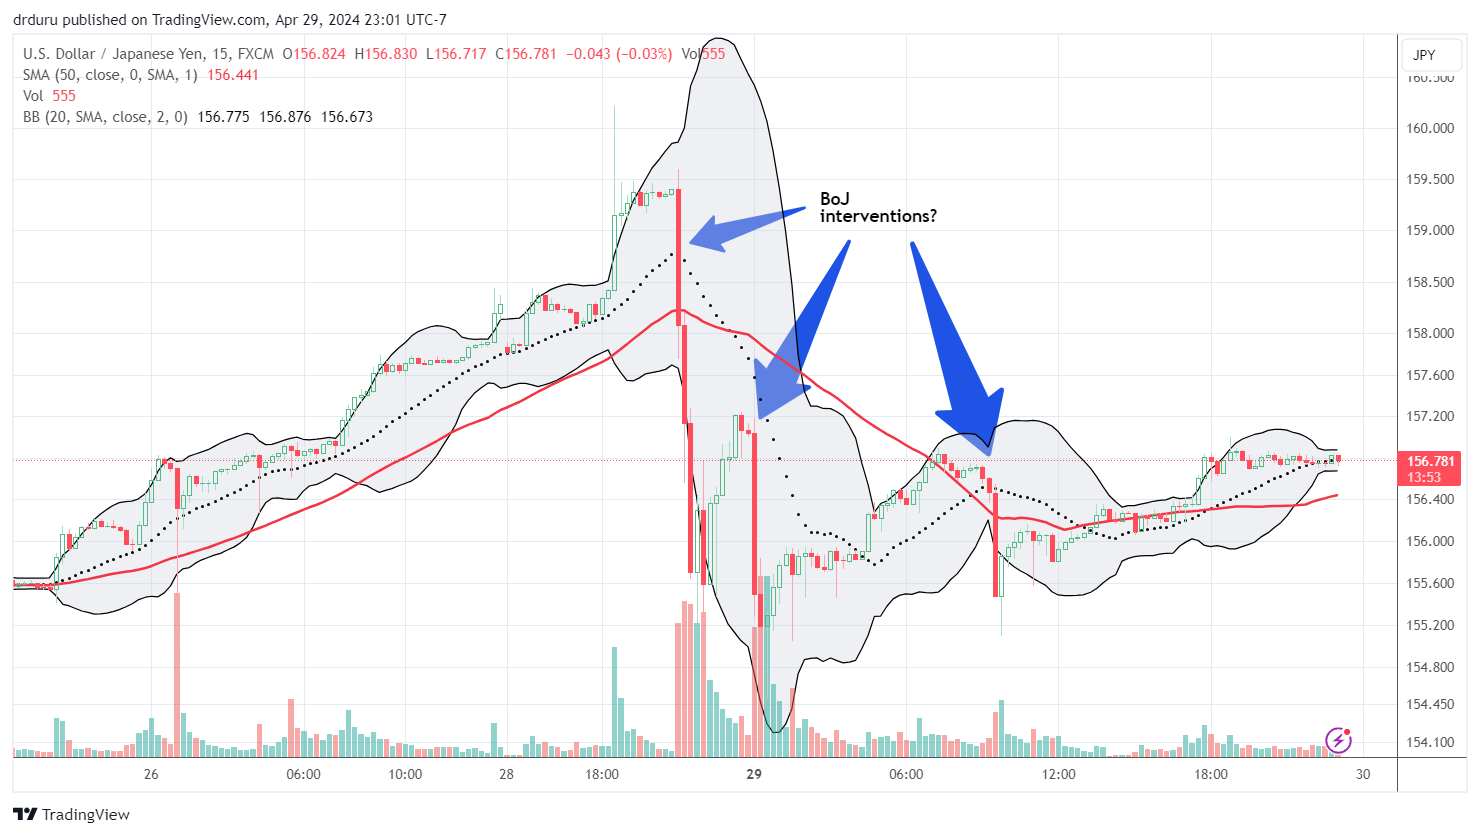
The US dollar versus the Japanese yen (USD/JPY) – the intraday view shows what a currency trap looks like.
Note the abrupt and swift prices moves downward followed by a rush of buyers. The selling pressure, the yen strength, had its most impact at the beginning of the pullback – a 45-minute descent. Note how afterward, the intervention was only able to string together two more significant price declines each lasting around 30 minutes. At the time of writing, USD/JPY is drifting and stabilizing.
The forces at play are so palpable that they provide some trading rules for short-term trades. Once the decline begins in the yen currency pair (yen strength), I chase the yen strength with sell stops on GBP/JPY. Once the buyers show up, I bail and switch to going long USD/JPY. Rinse and repeat. Some times two trades overlap which allows me some flexibility and reduced pressure to nail exact tops or bottoms in the volatility. At the time of writing, I still have this rule in place with a bias toward getting long USD/JPY after the dust seems to settle.
Of course, with a Federal Reserve meeting coming, I need to brace for even more violent price swings than those in the past 48 hours or so. Could the Bank of Japan actually take a hard gulp and announce a surprise tightening along with a dovish Fed announcement?! Oh the intrigue….
Finally, I show the multi-decade, quarterly chart below for context. There may be plenty of yen weakness ahead as long as the BoJ remains in this currency trap!
(Click on image to enlarge)
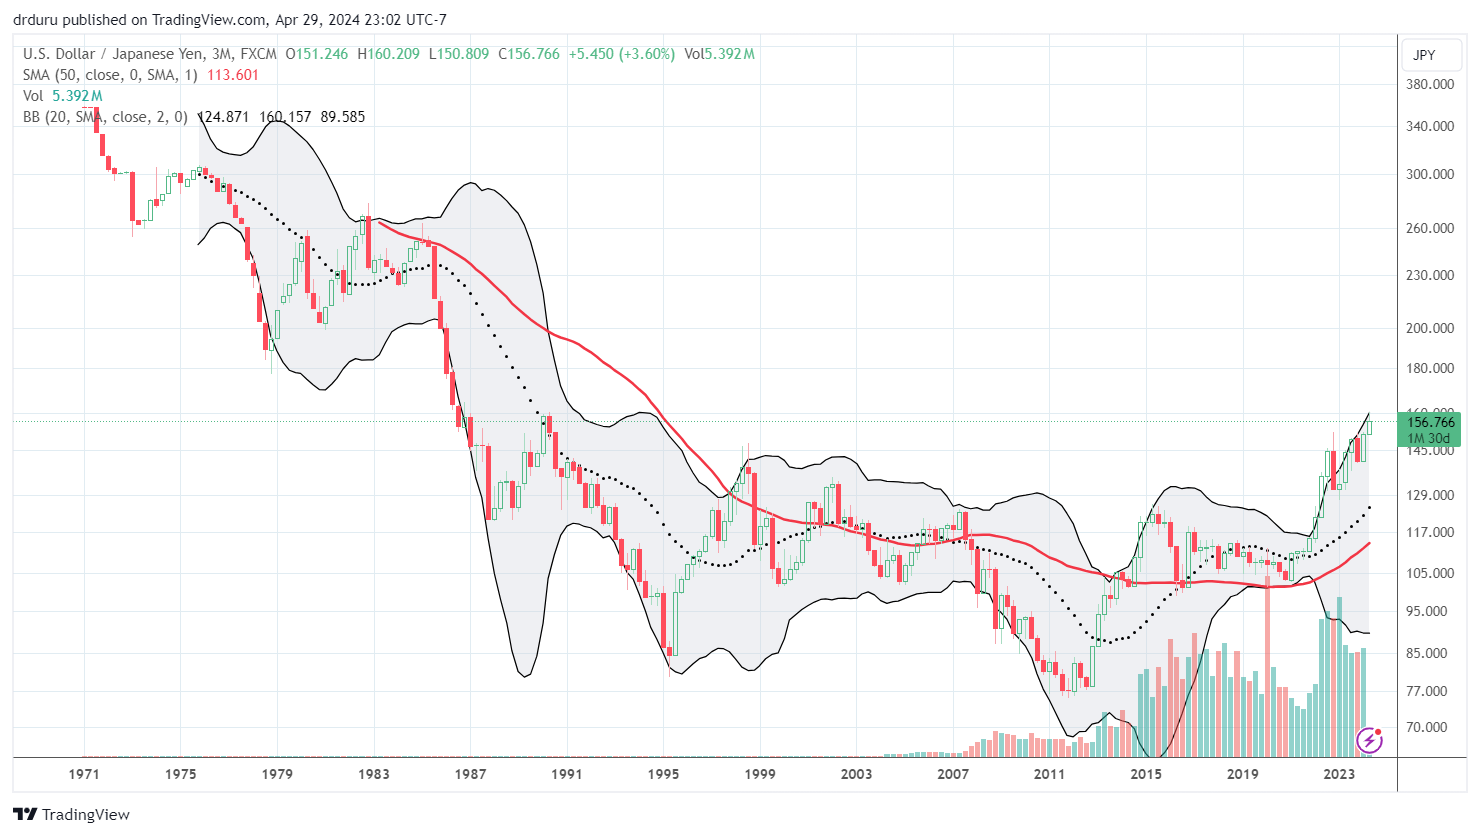
The US dollar versus the Japanese yen (USD/JPY) – the monthly view shows the potential for a lot more yen weakness ahead if the BoJ continues quantitative easing and accommodative policy.
Be careful out there!
More By This Author:
Financial Conditions Make A Monetary Roundtrip And Undercut The Need For Rate Cuts
From Inflation Fizzle To Sizzle
Small Caps Join The Party - But Just In Time For A Rotation?
Comments
Log in or sign up to join the conversation.