
Weekly Market Pulse: All Clear?
Why did stocks sell-off in recent months? Was it the emergence of the Omicron variant? That was a popular narrative right after Thanksgiving but that lasted less than a month before stocks decided to look past COVID make a new high right after the new year. Was the correction due to fears of the Fed raising interest rates and stopping QE? Was it the run-up to and eventual start of the Ukraine war? Or was it just that stocks got too expensive and no one wanted to buy at nosebleed levels? The answer would seem important at first blush since if we could identify the cause, we could determine whether it has been resolved and whether the furious rally last week made any sense.
Unfortunately, there is no way to know the “right” answer. We can’t know what every trader/investor was thinking when they pushed the sell button. Some might have sold because they needed the money for a down-payment on a house and felt some urgency because mortgage rates are rising. Some might have decided to head to the sidelines due to the Ukraine war. Some might have decided that the 1.94% they can now get on a 2 year Treasury note doesn’t sound that bad compared to the 1.3% dividend yield on the S&P 500, which also happens to include a lot more anxiety. Maybe it was none of those things. Or maybe it was all of those things and more.
Whatever caused the correction, there seemed to be a consensus last week that the all-clear had been sounded and it was okay to wade back in, especially to the growth stocks everyone was abandoning just a week or so ago. The Nasdaq composite rose over 8% last week while the S&P 500 value index managed about half that (which wasn’t bad considering it was down a lot less). Was the drop in oil prices the trigger? Oil prices fell over $15 on Monday and Tuesday as everyone stopped panicking and figured out that Russia is still selling a lot of oil and that isn’t likely to change, even if their customer base has some turnover. It rebounded Thursday and Friday though to close the week down about $6 and yet stocks continued to rally through Friday. Maybe the Fed finally actually doing something rather than just talking about it – sell the rumor, buy the fact – was the trigger. They hiked the Fed Funds rate – which is used by just about no one – by 1/4% on Wednesday and stopped buying bonds (we think), surprising exactly no one. Bonds did respond to more talking by Jerome Powell at his press conference but one can’t help but wonder why given his track record. I have said for a long time that monetary policy, such as it is, would be better conducted under a gag rule that applies anytime FOMC members are awake. Forward guidance only works if you can forecast and the Fed’s track record on that front makes your local weatherman look like a genius.
European stocks actually performed better than the Nasdaq last week so maybe it was positive developments in the Ukraine war that spurred the rally. We have discovered a lot about Russia during this war but mostly that their conventional forces probably don’t represent much of a threat to the rest of Europe. The Russian military has been hampered by poor logistics, poor strategy, incredibly poor tactical execution and low morale. Other than that things have been going swimmingly. The problem for Ukraine is that Putin is not burdened with a conscience and appears willing to sacrifice his soldiers and Ukrainian civilians to achieve his aims. Things might look better for the rest of Europe – if one assumes Putin can be restrained from using nukes – but for Ukraine, the situation remains pretty dire. So, maybe the rally in Europe made sense in light of what we’ve learned about Russia in the last 3 weeks.
But I don’t think there is any reason to get too excited about US growth stocks. The Nasdaq composite and the S&P 500 growth indexes are both trading below their 200 day moving averages and their 50-day moving averages have now crossed below the 200 day. Those are technical markers that confirm the underlying trend for those indexes is now down. That condition could reverse fairly quickly as it did in 2004, 2006, 2011, 2016, and after 2020 but we haven’t seen any extreme sentiment conditions yet so I have my doubts. Bottoms are generally made when pessimism is rampant and everyone is betting stocks will keep falling. The percentage of stocks above their 200 day MA will fall to the low teens or single digits. Put/call ratios will spike and short selling will be rampant. The only one of those we’ve seen so far is in the Nasdaq where the percentage of stocks above their 200 day MA fell to 14% in late January (not that it can’t go lower). The lowest reading for the S&P 500 was 36% in early March. That isn’t even close. The put/call ratio for individual stocks peaked at 0.82 in this correction; bottoms are generally not made until the ratio exceeds one (1.28 in 2020). The index only put/call ratio closed Friday at 1.07; bottoms usually see the ratio exceed 2 to 1. Traders are still too eager to be bullish for this to be a major low.
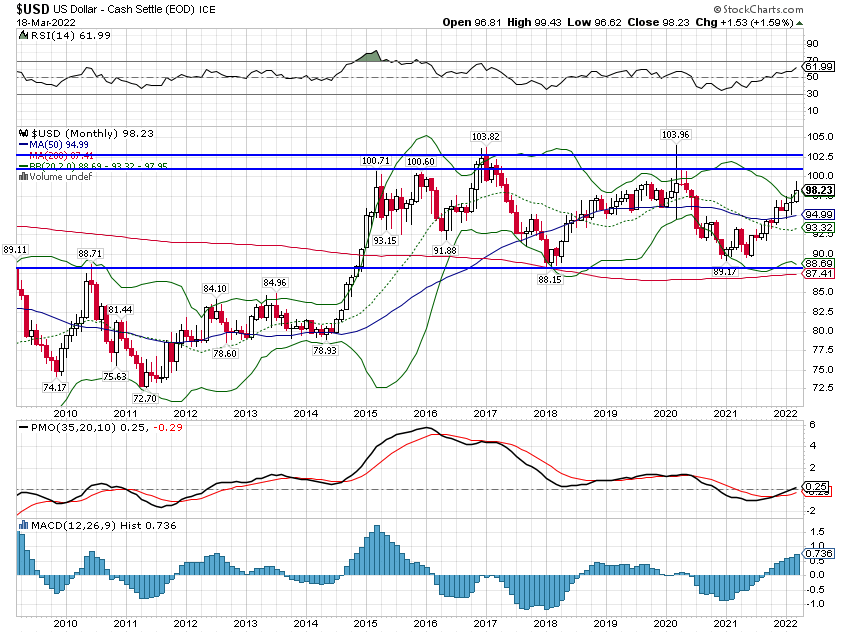
The leading styles right now, especially over the last 3 months are dividend and value, domestic and international. All these index ETFs are trading above their 200 day MA and the 50 day MA is above the 200 day; they are still in uptrends. From a valuation standpoint, international continues to trade cheaper than the US. The EAFE value index (EFV, Alhambra owns) has a dividend yield of over 4% and its holdings sound like a who’s who of international blue chips: Shell, Novartis, Toyota, BHP, HSBC, Total Energy, Nestle, Sanofi, Siemens, Glaxo Smith Klein, etc. The wild card for international stocks is, as always, the dollar. If the dollar is rising, non-dollar investments face a headwind that is hard to overcome. The dollar is near the top of its range but could still go higher.
(Click on image to enlarge)
Environment
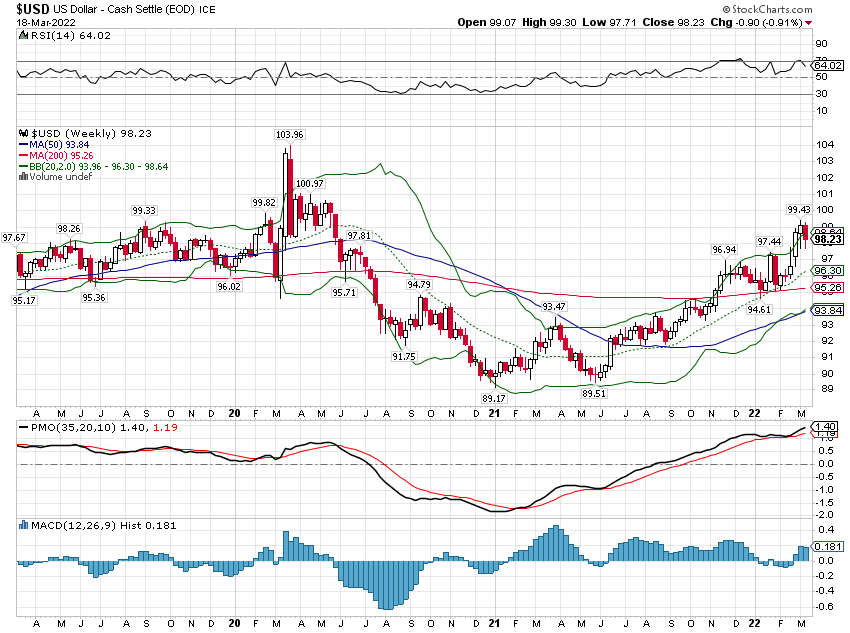
The dollar index fell nearly 1% last week but is still in an uptrend across shorter time frames. The long-term picture is one of stability – not a bad thing by the way – with the dollar index essentially unchanged over the last 7 years. We are closer to the top of the range and it is not surprising, given this history, to see it start to fall back some.
(Click on image to enlarge)
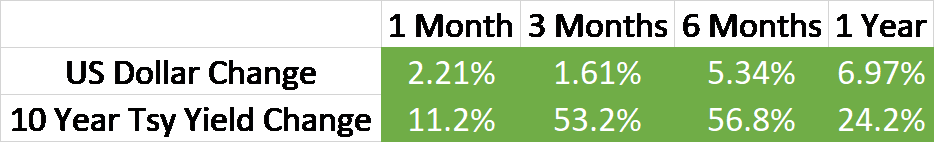
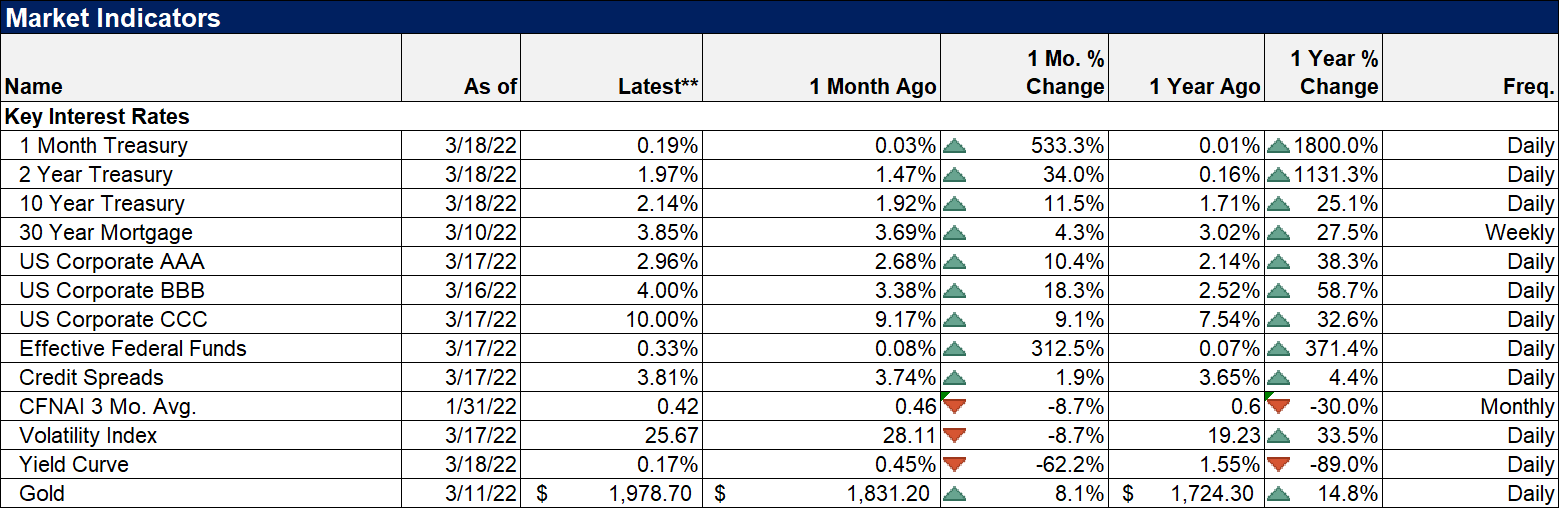
The 10 year Treasury yield is also in an uptrend with the rate hitting a cycle high of nearly 2.25% last week in the wake of the Fed hike of the Fed Funds (and others) rate last week. The yield curve continues to flatten with the 10/5 year version inverting briefly last week. Just as an FYI on that inversion, you might consider these dates: December 1965, April 1968, June 1971, August 1984, December 1994, and November 1997. Those are all dates when the 10/5 year curve inverted and a recession didn’t arrive within two years. Sometimes for a lot longer than 2 years. Yes, an inversion in the belly of the curve is not a positive sign of future economic growth. But the keyword there is future and how far in the future is highly variable. The 10/2 and the 10/3 month curves are much more important and timely. The 10/2 curve is now 17 basis points, down from about 1.6% in March of 2021 (which was quite a lot less than the peak of 2.5% seen in the last 3 cycles). What that means is that growth over the next 12 to 18 months is likely to slow. Based on the 10/3 month curve, the probability of recession in the next year remains in single digits but isn’t zero.
Yield curves are important indicators but it is important to put them in context. Whether a slowing economy is good or bad news depends on context too. GDP expanded by 5.7% in 2021 and while it might be nice to do that again in 2022, it probably isn’t realistic. So, to expect the economy to slow this year isn’t good or bad, just realistic. We will return to recession in due course and it may be sooner than we want, but it doesn’t appear imminent. If the 10/2 curve inverts soon – which looks pretty likely – and historical precedent prevails, we’ll probably enter recession between 6 months and 2 years later. For now, given that history, there is no macroeconomic reason to alter our strategic allocation.
One last note on yield curves; there is a 10/5 year Treasury curve that isn’t anywhere near inverting. That’s the 10-year TIPS to 5-year TIPS spread which currently stands at 55 basis points. That curve did invert prior to the last two recessions, in September of 2006 and 2018. What does it mean that the nominal curve is flat and near inversion but the real yield curve isn’t? For one thing, it means that inflation concerns are more urgent over the short term and not as urgent long term. Other than that? Not much I suspect but it is something to think about.
Markets Review
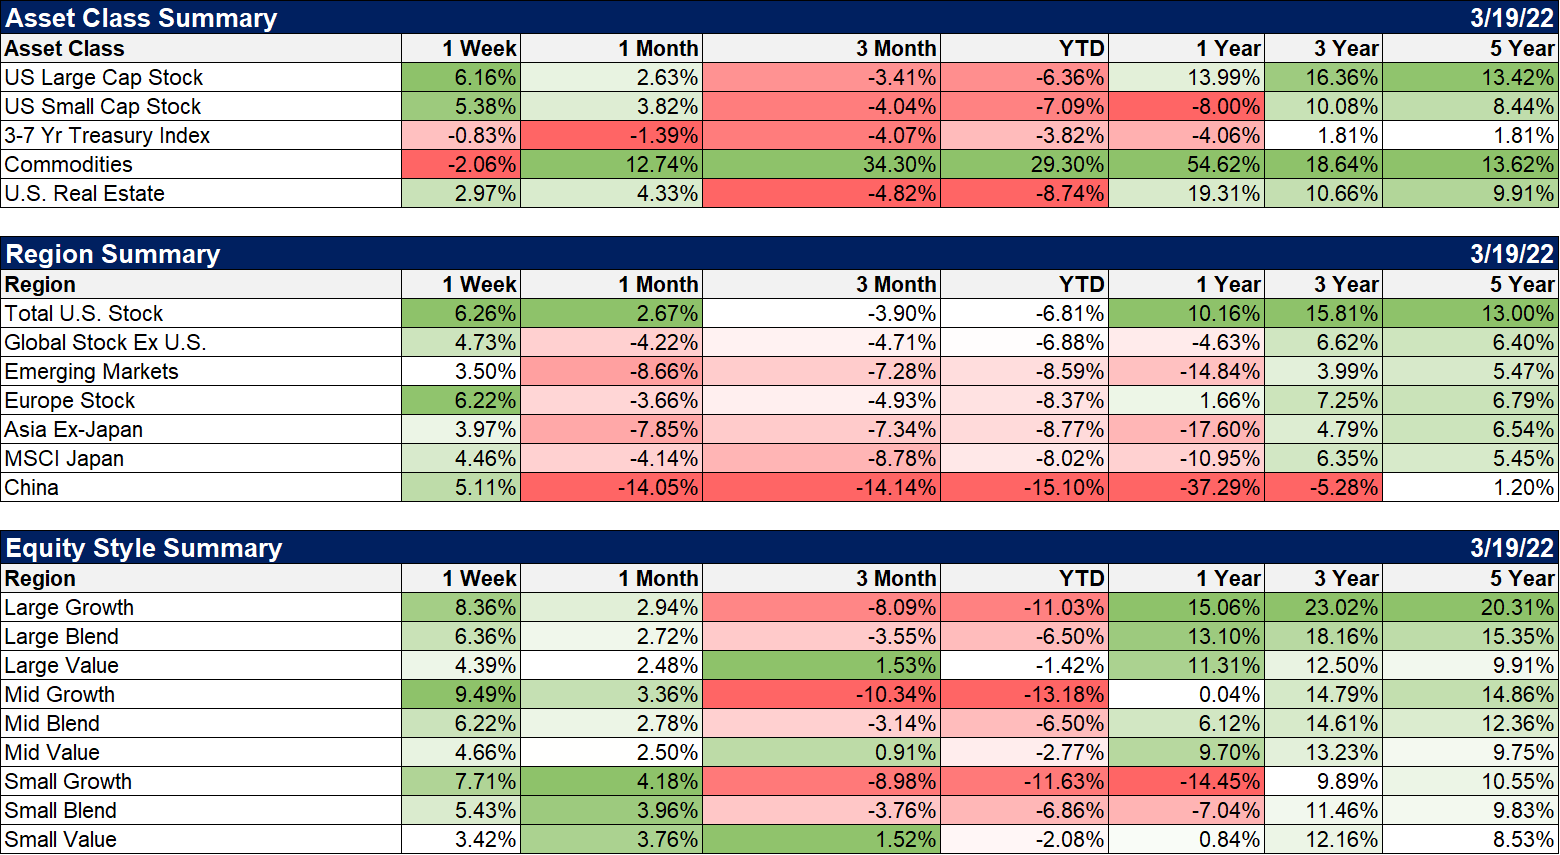
Stocks staged a furious rebound last week based on…well, I’m not exactly sure what it was based on other than the relief that oil prices didn’t continue to go straight up. Growth stocks led the way with the Nasdaq composite up over 8%. The Nasdaq and S&P 500 growth indexes are still both down double digits YTD while the S&P 500 value index is down just 1.42%. It is too early to say whether we have entered a long-term period of value outperformance but large cap value has outperformed large cap growth since late June of 2020. The value outperformance in small cap goes back even further. So, it may not be a long-term trend yet but it isn’t that new either.
Commodities were down last week as crude oil dropped 5.7% and fell all the way to $93.41 before rebounding Thursday and Friday. Russian oil is still getting to the market and I expect that to be true no matter what happens with sanctions. If India can get a discount by purchasing Russian oil – and they can – then they are going to do it and I highly doubt the US can or will do anything about it. There are commodities that are going to be affected by the conflict – mostly agriculture – but most commodities that come out of Russia will remain well supplied.
European markets also staged a big rebound last week and are now down just about 3% from prior to Russia’s invasion. For US investors last week’s gains were aided by a Euro that rose 1.6%.
(Click on image to enlarge)
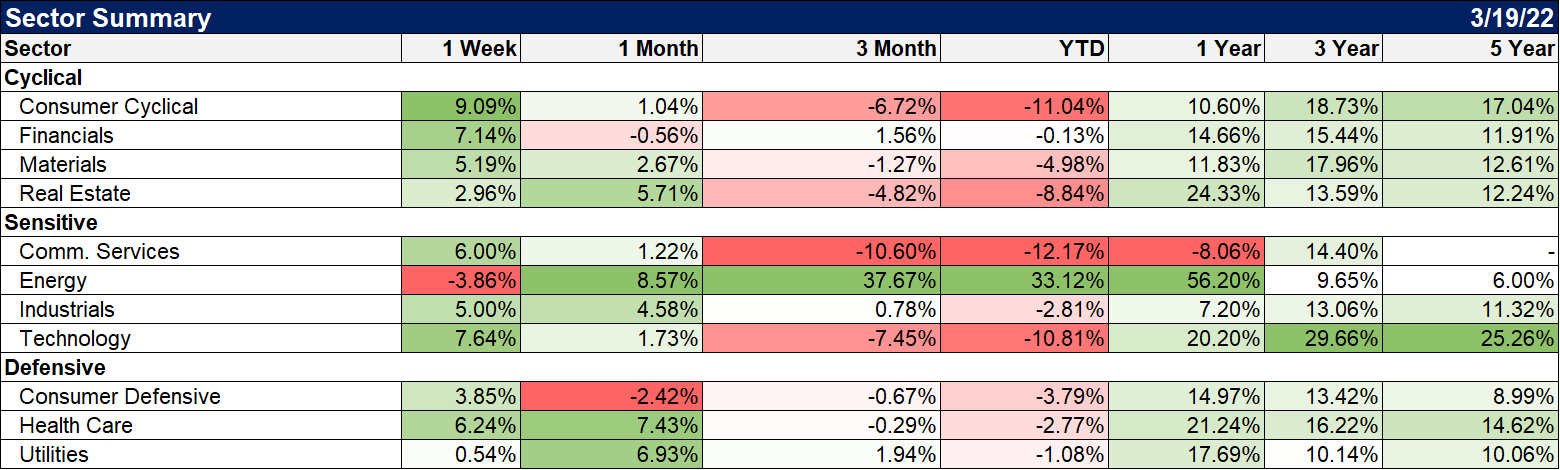
Consumer cyclicals was the leading sector last week as the Fed hiked rates and the economy didn’t immediately enter a recession. Financials also had a good week despite the flattening yield curves which should probably tell you how much the spread between the 10 year and 5 year Treasury yield means to the big banks – not much. Technology was the other big winner as growth stocks staged a comeback but I am not convinced at all that this correction – in growth stocks generally and technology specifically – is over; growth is still not cheap. There is a good chance that this is nothing more than a rally in an ongoing downtrend.
(Click on image to enlarge)
Credit spreads narrowed following the Fed’s rate change last week. That is a reminder that while yield curves may be pointing to a future slowdown, there isn’t any fear – yet – that it will cause credit problems. We’ll probably have to get a lot closer to recession before that starts to get priced in. Also, notable last week was the drop in gold prices (gold prices in this chart are a week behind for some reason; someone should fix that) which peaked at nearly $2100 on March 8th. 10-year TIPS yields hit their nadir on the same day and are now back up to where they were in January. Tips yields and gold are negatively correlated as TIPS yields are also an indication of real growth expectations.
(Click on image to enlarge)
What the market does on a week-to-week basis doesn’t usually mean all that much. Market sentiment today, based on surveys such as the American Association of Individual Investors or Investor’s Intelligence, is pretty bearish. Not many people are willing to admit being bullish right now. But actions speak louder than words and those put/call ratios I cited above say there were lots of bulls in the market last week betting on more gains. At the bottom, everyone will still be betting on further declines. All clear? Not yet.
Disclosure: This material has been distributed for informational purposes only. It is the opinion of the author and should not be considered as investment advice or a recommendation of any ...
more

