
As measured by NY Fed WEI, OECD Weekly Tracker, and Baumeister, Leiva-Leon and Sims WECI.
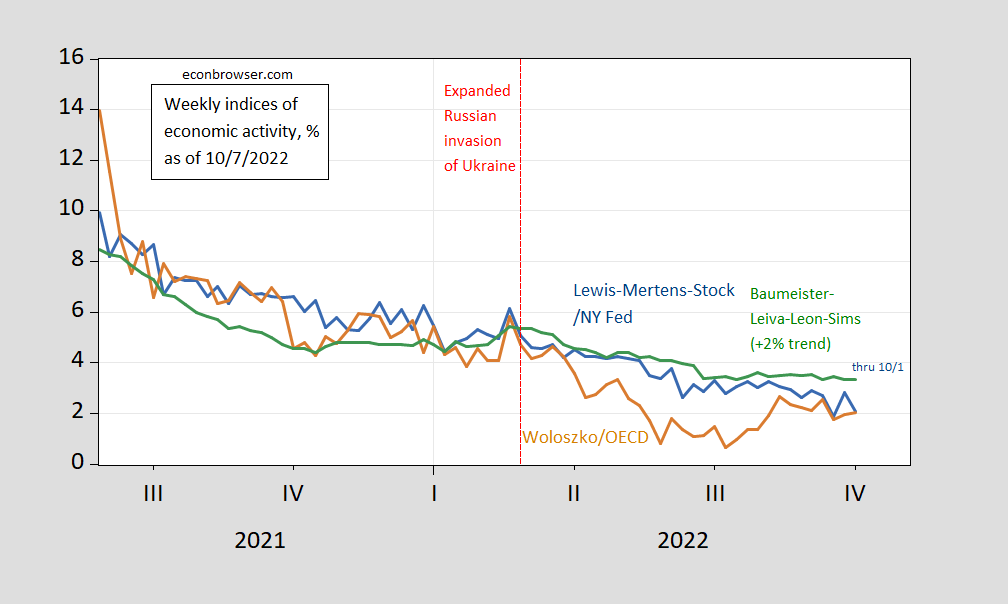
Figure 1: Lewis-Mertens-Stock (NY Fed) Weekly Economic Index (blue), Woloszko (OECD) Weekly Tracker (tan), Baumeister-Leiva-Leon-Sims Weekly Economic Conditions Index for US plus 2% trend (green) Source: NY Fed via FRED, OECD, WECI, and author’s calculations.
The WEI fell from the previous week, down to 2.1% from 2.8%, while the Weekly Tracker continued to rise. The divergence, which is not surprising, given the large differences in methodologies, has closed in recent weeks. The WEI relies on correlations in ten series available at the weekly frequency (e.g., unemployment claims, fuel sales, retail sales). The Weekly Tracker — at 2.0% — is a “big data” approach that uses Google Trends and machine learning to track GDP.
The WEI reading for the week ending 10/1 of 2.1% is interpretable as a y/y quarter growth of 2.1% if the 2.1% reading were to persist for an entire quarter. The OECD Weekly Tracker reading of 2% is interpretable as a y/y growth rate of 2% for year ending 10/1 (this series was revised downward noticeably from last release). The Baumeister et al. reading of 3.4% is interpreted as a 1.4% growth rate in excess of long term trend growth rate. Average growth of US GDP over the 2000-19 period is about 2%, so this implies a 3.4% growth rate for the year ending 10/1.
Since these are year-on-year growth rates, it’s possible we were in a recession in H1 as one observer suggested a bit over a month ago, but it (still) seems unlikely.
More By This Author:
The Employment Report And Business Cycle IndicatorsThe Chinn-Ito Financial Openness Index Updated to 2020
Jobs Vs. Employment In The CES And CPS Employment Series


Comments
Log in or sign up to join the conversation.