Weekly Forex Forecast - Sunday, Oct. 26
Image Source: Unsplash
Fundamental Analysis & Market Sentiment
I wrote on the 19th October that the best trades for the week would be:
- Long of the USD/JPY currency pair following a New York close above ¥153.08.
- Long of Gold following a daily (New York) close above $4,326.
- Long of Silver following a daily (New York) close above $54.25 with a small position.
- Long of Platinum following a daily (New York) close above $1,716 with a small position.
- Long of the NASDAQ 100 Index following a daily (New York) close at or above 25,187.
- Long of the S&P 500 Index following a daily (New York) close at or above 6,766.
None of these trades set up until Friday’s close, so there were no trades last week.
A summary of last week’s most important data:
- US CPI (inflation) – all the data came in 0.1% lower than expected, which boosted stock markets but had very little effect on the US Dollar.
- US, German, British Flash Services & Manufacturing PMI – all data were more robust than expected.
- UK CPI (inflation) – the annualized rate was expected to increase from 3.8% to 4.0%, but remained unchanged, which weakened the Pound somewhat as it dampened prospects for a rate cut.
- Canadian CPI (inflation) – this was higher than expected, increasing by 0.1% month-on-month when it was expected to contract by the same amount, which may have helped keep the Loonie relatively strong over the week.
- New Zealand CPI (inflation) – this was higher than expected, which may have helped keep the Loonie relatively strong over the week.
Last week’s big event was Friday’s lower than expected US CPI (inflation) data, which effectively gave the Federal Reserve every reason to make a rate cut of 0.25% at its meeting this week, and again at its meeting in December. This pushed major US stock market indices to new all-time highs, most strongly in the tech-focused NASDAQ 100 Index.
We saw UK inflation data surprise analysts to the downside, which triggered a dip in the British Pound. However, inflation data released in Canada and New Zealand were higher than expected, suggesting there are still inflationary pressures alive and well in the global economy.
It was a relatively minor detail but the broadly better than expected PMI data in major economies probably added a little to the generally bullish mood in stocks.
US President Trump has begun a tour of Asia, which will conclude on Thursday in a meeting with Chinese leader Xi. This dovetails with the 1st November deadline on which President Trump’s new 100% tariff on Chinese imports will be take effect, unless he stops or amends it. It is widely expected that Trump and Xi will make a mutually beneficial deal on tariffs and rare earths export restrictions, and whether that is concluded well or not, we can expect some strong volatility is likely in markets at the end of the week. Trump’s meetings with leaders during the earlier part of the forthcoming week might also trigger movement in particular markets and currencies from day to day.
There will be four major central bank policy meetings over the coming week.
The US government shut down goes on but is having little effect.
Keep in mind that many countries have put their clocks back an hour over this weekend to switch away from summer time but North America has yet to move, so time zone differentials have changed by an hour between North America and elsewhere.
The Week Ahead: 27th– 31st October
The coming week will probably see more activity in the market, due to the Trump / Xi meeting, and the four major central banks which will be holding policy meetings this week. Two of the banks (The US Federal Reserve and the Bank of Canada) are expected to announce rate cuts of 0.25%.
This week’s most important data points, in order of likely importance, are:
- US Federal Reserve Policy Meeting
- European Central Bank Policy Meeting
- Bank of Japan Policy Meeting
- US Core PCE Price Index
- US Advance GDP
- Bank of Canada Policy Meeting
- US Employment Cost Index
- Australian CPI (inflation)
- Canadian GDP
- Chinese Manufacturing PMI
Due to the ongoing government shutdown in the USA, US data may be postponed indefinitely.
Monthly Forecast October 2025
(Click on image to enlarge)

Currency Price Changes and Interest Rates
For the month of October 2025, I forecasted that the EUR/USD currency pair would rise in value. Its performance so far this month is shown in the table below.

October 2025 Monthly Forecast Performance to Date
Weekly Forecast 26th October 2025
I made no weekly forecast last week.
Although there were notably larger price movements in the Forex market last week, there were still no unusually large price movements in currency crosses, so I have no weekly forecast this week.
The Australian Dollar was the strongest major currency last week, while the Japanese Yen was the weakest. Directional volatility increased last week, with 37% of all major pairs and crosses changing in value by more than 1%.
Next week’s volatility is quite likely to increase.
Technical Analysis
Key Support/Resistance Levels for Popular Pairs
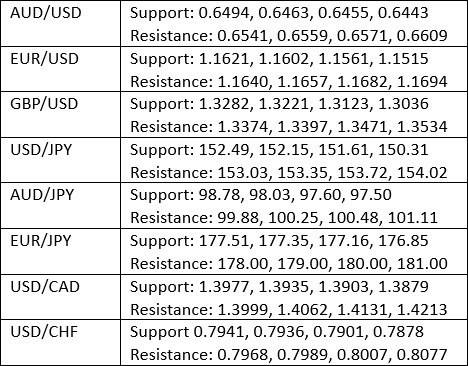
Key Support and Resistance Levels
US Dollar Index
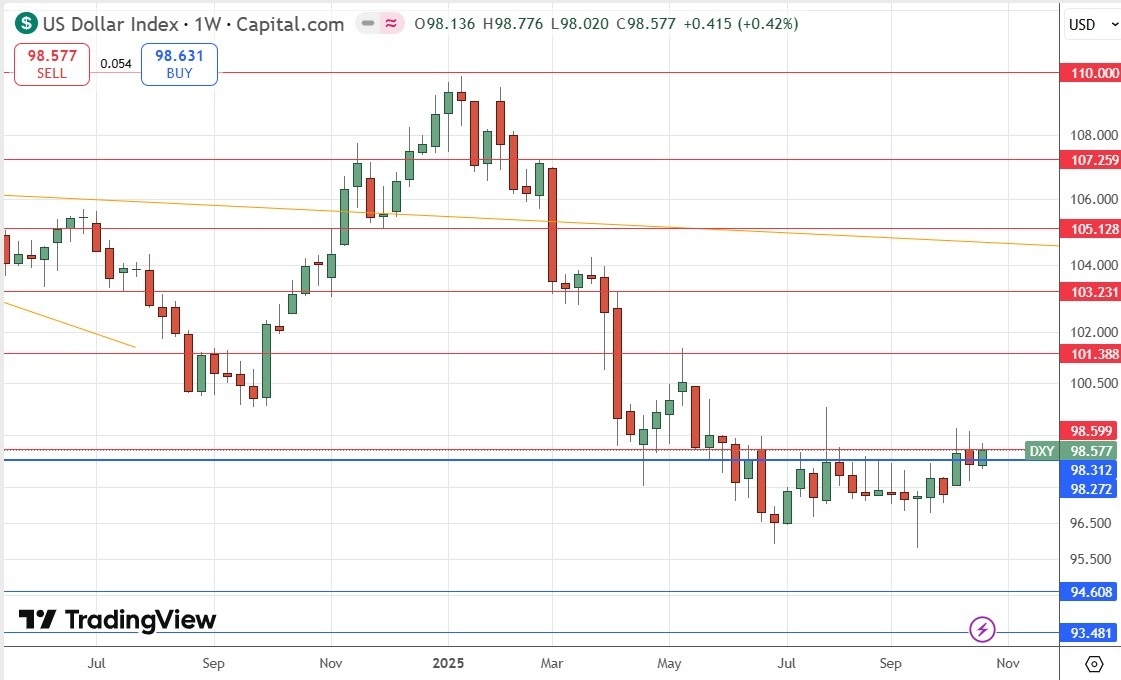
Last week, the US Dollar Index printed a bullish inside bar pattern with small wicks on both the upper and lower side. However, what is most significant here is the fact that the price has again failed to make a weekly close above the key resistance level at 98.60. If we do eventually get a breakout above this level by the US Dollar, we have already seen a real bottom put in so this could be the start of a major long-term upwards trend. Despite being just below its level of 26 weeks ago, the price is above where it was 13 weeks ago, so by my preferred metric, I can declare the long-term bearish trend is over. This places the US Dollar in an interesting position and very close to technically starting a new long-term bullish trend.
The Dollar may take a hit over the coming days if China does not back down over its proposed rare earth export restrictions in the face of President Trump’s 100% China tariff threat, but this situation is producing much more predictable movement in other currencies such as the Australian and New Zealand Dollars (heavily linked to the Chinese economy) and the Japanese Yen (the current haven currency of choice). The Canadian Dollar, as a proxy for Crude Oil, is also sensitive to perceived changes in risk-on demand. President Trump and President Xi will be meeting Thursday, and the tariff deadline is next weekend, so it should be an interesting and decisive week.
The Federal Reserve will be holding a policy meeting this week and is almost unanimously expected to cut its interest rate by 0.25%. That meeting will likely also trigger USD volatility.
I will be most comfortable being long of USD above 98.31 and even more so above 98.60.
(Click on image to enlarge)
US Dollar Index Weekly Price Chart
USD/JPY
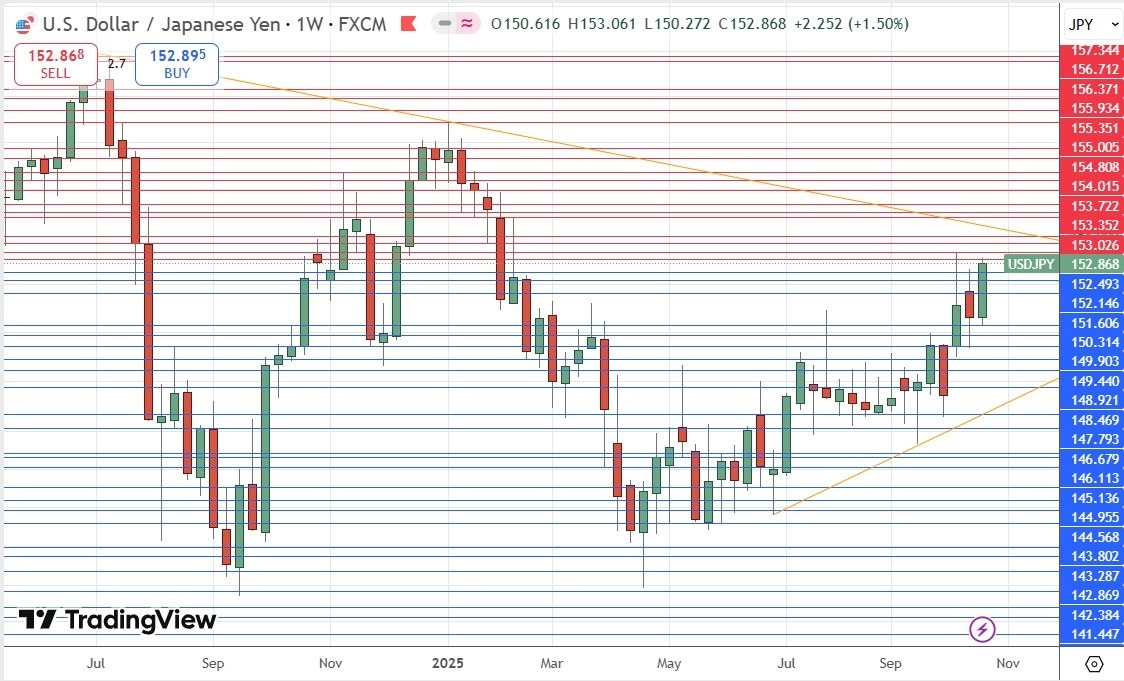
The USD/JPY currency pair weekly chart printed a large, bullish candlestick with little upper wick which engulfed the real body and upper wick of the previous week’s range. These are bullish signs, and we are in a bullish long-term trend which was triggered by a recent breakout to a new 6-month high price, and such breakouts in this currency pair have historically tended to give traders a trend-following edge.
It should be noted on the bearish side, that the long-term price chart below shows that there is an important upper trend line in the dominant narrowing triangle pattern which has not even been tested yet. However, this probably will not happen until the price reaches the ¥155 area, so bullish action still has a meaningful way to run.
This is likely to be an important week for this currency pair, with the US Federal Reserve and the Bank of Japan both holding policy meetings, an incoming Japanese Prime Minister whose policies are sending the Yen lower, and a tariff showdown between President Trump and China’s President Xi scheduled for this Thursday.
If the developments of this week, especially Thursday’s meeting, are seen as good for the global economy and trade, we will probably see this pair rise significantly.
Like many trend traders, I am already long of this currency pair, but for a new long trade entry, I would like to see a daily (New York) close above ¥153.08.
(Click on image to enlarge)
USD/JPY Weekly Price Chart
S&P 500 Index
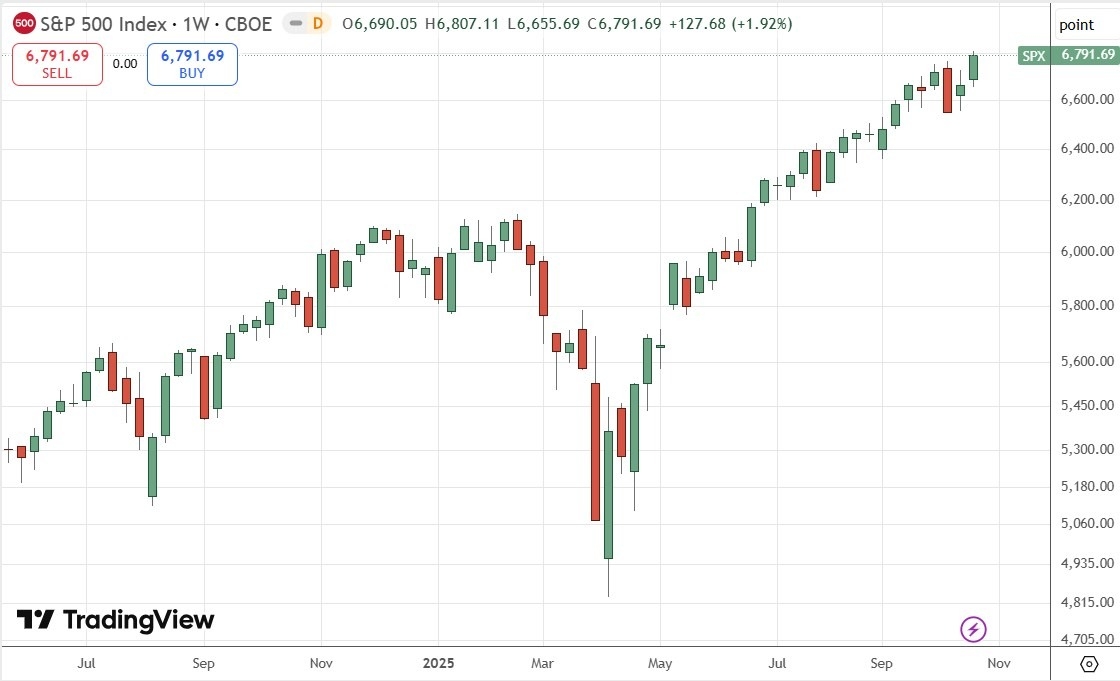
The Index started last week higher and showed a muted bullishness until Friday’s lower-than-expected CPI (inflation) data was released, which looks likely to put the Fed more firmly on a path of rate cuts, with two cuts in 2025 virtually assured.
Markets reacted to this by moving firmly though not excessively higher, with tech stocks leading the way, which caused this index to underperform the tech-based NASDAQ 100 Index but close at a new record high, very near the high, which was a short way above 6,800.
US stock market indices going to a new record high is one of the best bullish signs you can get, as is a rate cut and a trade deal, and both of those latter two are on the cards to happen later this week. These events could send this index even higher, so I think it makes sense to be long here already without any conditions.
If Thursday’s meeting between President Trump and President Xi does not lead to a satisfactory deal on rare earths export from China – which would be surprising – we would certainly see this Index fall strongly at the end of this week.
It is very easy to assume this trend is overstretched and cannot last. For traders, trying to pick the top of a stock market rally is very unlikely to be useful.
(Click on image to enlarge)
S&P 500 Index Weekly Price Chart
NASDAQ 100 Index
Everything I wrote above about the S&P 500 Index also applies to the NASDAQ 100 Index, but it is worth noting that the NASDAQ 100 outperformed the S&P 500 last week, and the price chart shown below is more bullish.
The tech-base index’s outperformance against the broader market suggests that markets believe China and the USA will make a deal about rare earth exports and tariffs.
I remain long here and think it makes sense to be long of this index without any conditions.
(Click on image to enlarge)
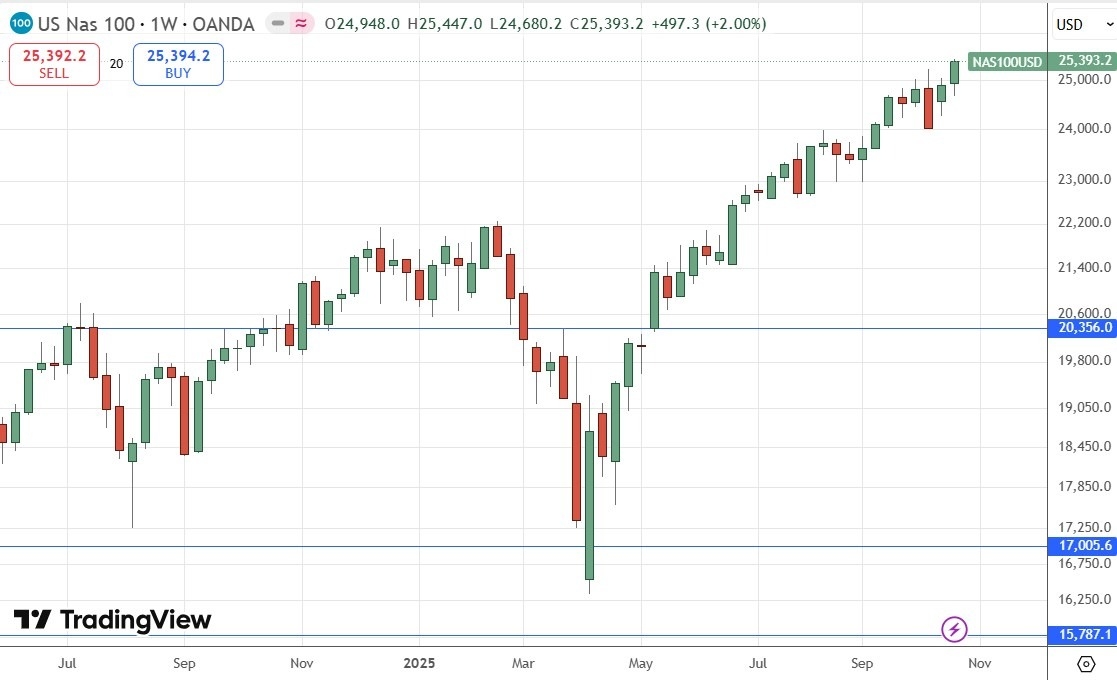
NASDAQ 100 Index Weekly Price Chart
KOSPI Composite
The main South Korean equity index has put in a stunning performance this year, significantly surpassing even the traditionally dominant US market. The Index is up almost 70% since April, an astonishing advance, driven partly by the global tech boom and partly by legal reforms affecting corporate governance and the stock market.
The last two weekly candlesticks have been long, strong, and both closed very near their respective highs.
A new long trade is certainly likely to be late to the party, but maybe a quarter-sized long position using a trailing stop could be a sensible trade.
(Click on image to enlarge)
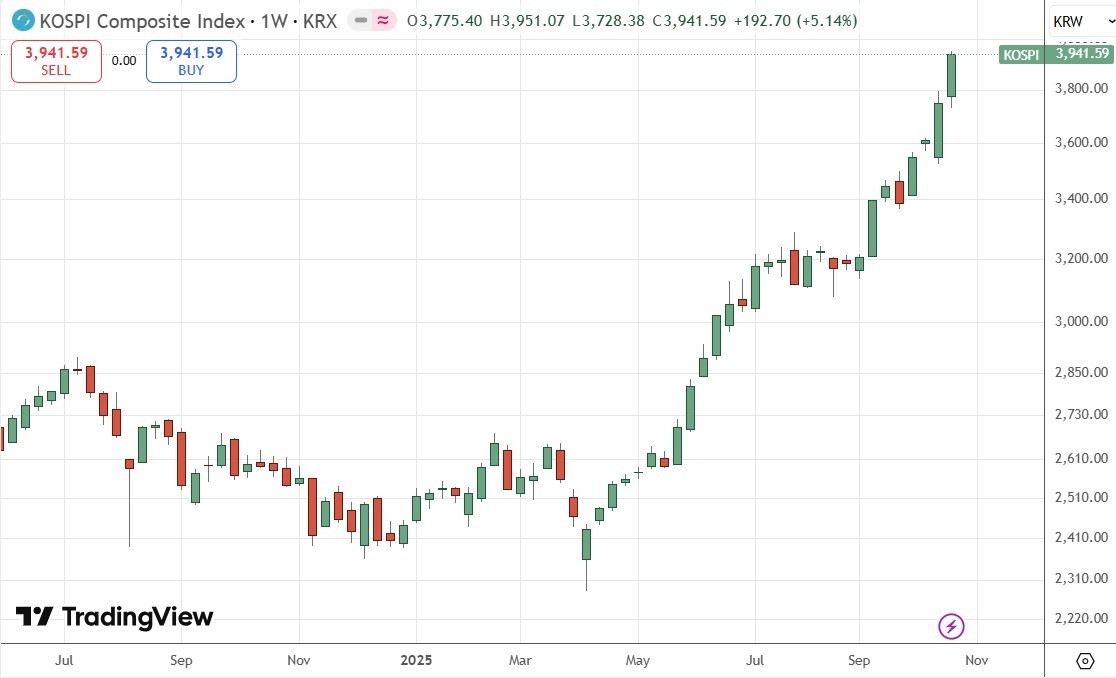
KOSPI Composite Price Chart
Nikkei 225 Index
The main Japanese equity index the Nikkei 225 has put in a great performance this year, surpassing even the traditionally dominant US market. The Index is up by more than 60% since April, an astonishing advance, driven partly by the global bull market and partly by an increasing sense that Japan is really coming back economically after a long period of deflation.
A new long trade is certainly likely to be late to the party, but maybe a quarter-sized long position using a trailing stop could be a sensible trade.
Although the price closing at a record high is certainly a bullish sign, there are two things here bulls should watch out for:
- The sizable upper wick of last week’s candlestick.
- The huge round number just above at 50,000 which is very likely to see some profit-taking and so will probably act as strong resistance.
For these reasons, I would only want to take a small long trade, and that only after we get a daily close above 50,000.
(Click on image to enlarge)
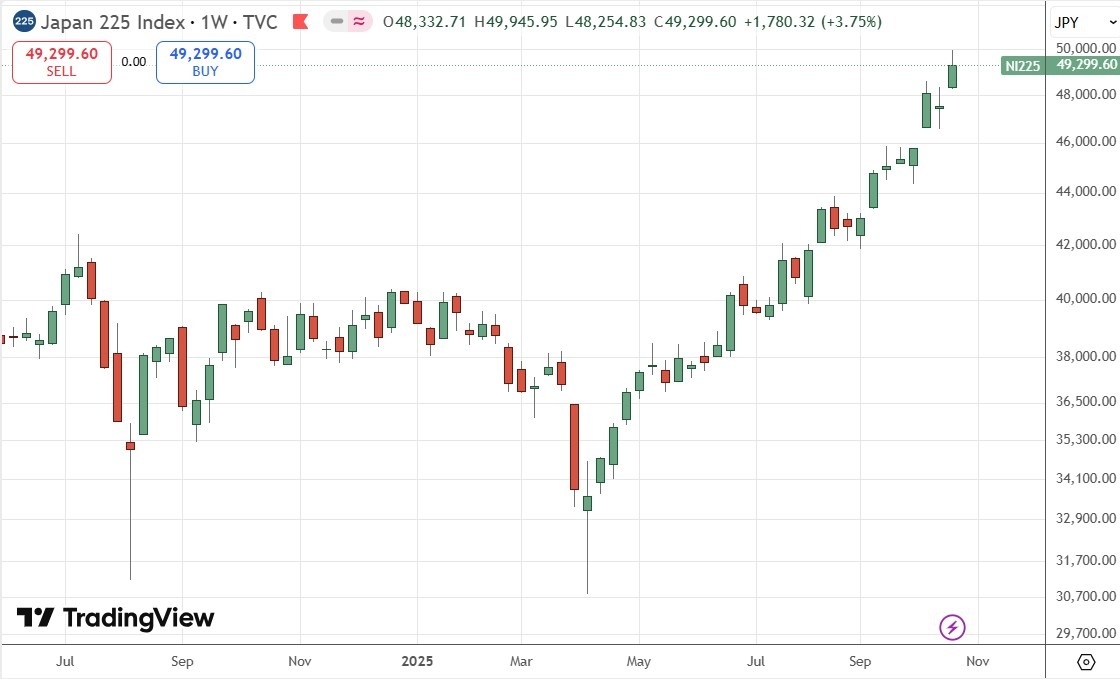
Nikkei 225 Index Price Chart
Bottom Line
I see the best trades this week as:
- Long of the USD/JPY currency pair following a daily (New York) close above ¥153.08.
- Long of the NASDAQ 100 Index.
- Long of the S&P 500 Index.
- Long of the KOSPI Composite with a ¼ size position.
- Long of the Nikkei 225 Index following a daily close above 50,000 with a ¼ size position.
More By This Author:
Forex Today: UK Inflation Surprises At 3.8%
Forex Today: Gold Touches New Record High At $4,381
The Best Semiconductor Stocks To Buy Now
Risk Disclaimer: DailyForex will not be held liable for any loss or damage resulting from reliance on the information contained within this website including market news, analysis, trading signals ...
more


