The Best Semiconductor Stocks To Buy Now
Image Source: Unsplash
Semiconductor stocks refer to publicly listed companies that design and manufacture computer chips, also known as semiconductors. They are an essential component in today’s world, as they power everything from cars to consumer electronics, from telecommunication to energy, and from defense to artificial intelligence.
A semiconductor is a material with electrical conductivity to regulate electrical currents, embedded with tiny circuits. Without semiconductors, we would have computer chips with the most basic functions. The sophistication of semiconductors ranges from simple ones that power kitchen appliances to cutting-edge graphics processing units (GPUs) required by artificial intelligence (AI) and defense solutions.
Why Consider Buying Semiconductor Stocks?
Semiconductor stocks drive the global economy, and the integration of AI, combined with the recent boost in defense spending, will continue to fuel growth. Some investors compare semiconductor companies to the internet companies during the Dot-Com boom and bust, which have created today’s Magnificent Seven.
Here are a few things to consider when evaluating semiconductor stocks:
- Semiconductors are at the forefront of technological innovation, including AI and quantum computing.
- Investors must brace for volatility.
- Cyclical cycles will impact the share price of semiconductor stocks.
- The regulatory landscape is bound to change and adapt.
- Most semiconductor stocks have excessive valuations.
What are the Downsides of Semiconductor Stocks?
Many countries consider semiconductors as a national security item, as evident in the Sino-US geopolitical tensions. The industry also relies heavily on Taiwan, with a small but significant factor from the Netherlands. Therefore, supply chain disruptions can distort the investing landscape. High research and development costs and the difficulty and expense of fabrication plants create tremendous barriers for new entrants to disrupt the sector. Additionally, each significant R&D breakthrough can render previous chips obsolete.
Here is a shortlist of semiconductor stocks to consider:
- ASML (ASML)
- Qualcomm (QCOM)
- Texas Instruments (TXN)
- Credo Technology Group (CRDO)
- Rambus (RMBS)
- Taiwan Semiconductor Manufacturing (TSM)
- Applied Materials (AMAT)
- NXP Semiconductors (NXPI)
- Micron Technology (MU)
- Arm Holdings (ARM)
Update on My Previous Best Semiconductor Stocks to Buy Now
In our previous installment, I highlighted the upside potential of ASML and Qualcomm.
ASML (ASML) - A long position in ASML between $701.19 and $730.60
ASML rallied over 45%, and I closed my position at an even $1,000.00. It dropped below $1,000 before pushing higher once again, but I will not re-enter at current levels.
Qualcomm (QCOM) - A long position in QCOM between $20.15 and $20.97
QCOM advanced by over 15%, and my stop-loss triggered at $168.00, for a profit of over 13%. I will monitor price action for a new entry level.
Texas Instruments Fundamental Analysis
Texas Instruments ranks among the Top 10 semiconductor companies based on sales volume globally. Over 80% of its revenue comes from analog chips and embedded processors. It is also a member of the NASDAQ 100, the S&P 100, and the S&P 500 indices.
So, why am I bullish on TXN despite its 20%+ plunge?
While Texas Instruments was active in artificial intelligence in the 80s, I like this semiconductor company for its focus on analog chips, where it has few competitors, and a growing, stable customer base outside the AI hype. I am also optimistic about the fab investments, where TXN was early to recognize the need, and expect the recent leadership change to maintain the existing stability.
|
Metric |
Value |
Verdict |
|
P/E Ratio |
32.28 |
Bullish |
|
P/B Ratio |
10.11 |
Bearish |
|
PEG Ratio |
1.56 |
Bullish |
|
Current Ratio |
5.81 |
Bullish |
|
Return on Assets |
14.36% |
Bullish |
|
Return on Equity |
30.57% |
Bullish |
|
Profit Margin |
30.07% |
Bullish |
|
ROIC-WACC Ratio |
Positive |
Bullish |
|
Dividend Yield |
3.10% |
Bullish |
Texas Instruments Fundamental Analysis Snapshot
The price-to-earnings (P/E) ratio of 32.28 makes TXN an inexpensive stock. By comparison, the P/E ratio for the NASDAQ 100 Index is 38.08.
The average analyst price target for Texas Instruments is $202.85. It suggests good upside potential with manageable downside risks.
Texas Instruments Technical Analysis
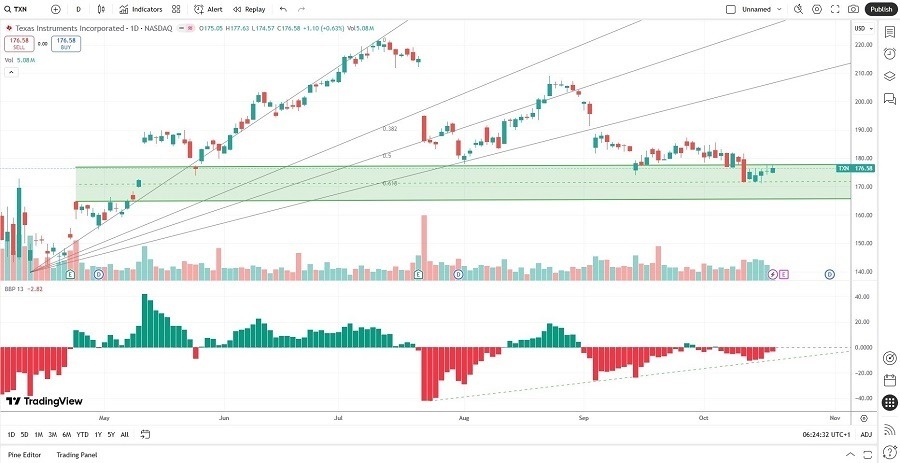
(Click on image to enlarge)

Texas Instruments Price Chart
- The TXN D1 chart shows price action below its ascending Fibonacci Retracement Fan.
- It also shows Texas Instruments inside a horizontal support zone with rising breakout pressures.
- The Bull Bear Power Indicator is bearish with a positive divergence.
My Call on Texas Instruments
I am taking a long position in TXN between $165.00 and $177.92. TXN ranks among the semiconductors with the healthiest balance sheet, boasts industry-leading performance metrics, with low valuation compared to its peers, and an excellent PEG ratio. It ranks as one of my top semiconductor picks right now.
NXP Semiconductors Fundamental Analysis
NXP Semiconductors is a semiconductor manufacturing and design company, the third-largest European semiconductor company by market capitalization, and the co-inventor of near field communication (NFC) technology. It is also a member of the NASDAQ 100 and the S&P 500 indices.
So, why am I bullish on NXPI following its breakdown?
NXP Semiconductors is another analog semiconductor play, and I am cautiously optimistic about its next earnings release. Valuations are low for a semiconductor stock, and NXPI has excellent profit margins, but its heavy exposure to the auto sector explains recent weakness in its share price. Unlike most of its peers, it stays out of the headlines and delivers steady, long-term growth and free cash flow, and management has indicated signs of a fresh upcycle.
|
Metric |
Value |
Verdict |
|
P/E Ratio |
25.58 |
Bullish |
|
P/B Ratio |
6.00 |
Bearish |
|
PEG Ratio |
1.13 |
Bullish |
|
Current Ratio |
1.74 |
Bearish |
|
Return on Assets |
8.51% |
Bullish |
|
Return on Equity |
22.45% |
Bullish |
|
Profit Margin |
17.72% |
Bullish |
|
ROIC-WACC Ratio |
Positive |
Bullish |
|
Dividend Yield |
1.87% |
Bearish |
NXP Semiconductors Fundamental Analysis Snapshot
The price-to-earnings (P/E) ratio of 25.58 makes NXPI an inexpensive stock. By comparison, the P/E ratio for the NASDAQ 100 index is 38.08.
The average analyst price target for NXP Semiconductors is $258.43. It suggests good upside potential with reasonable downside risks.
NXP Semiconductors Technical Analysis
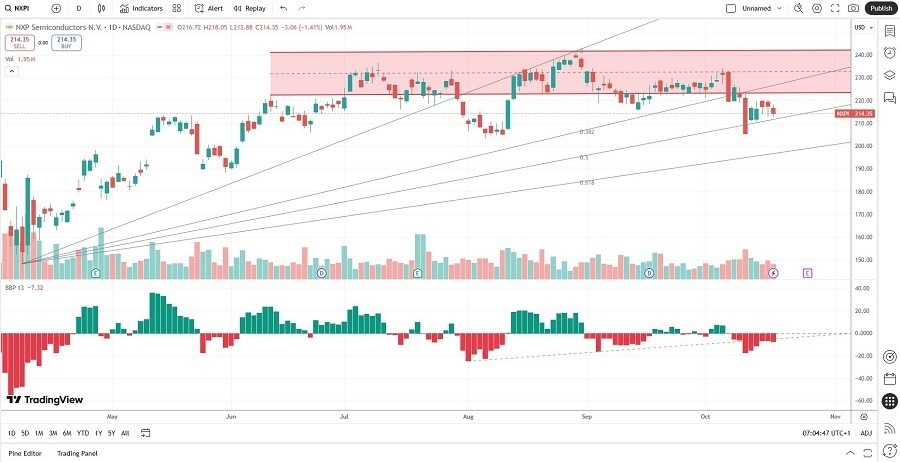
(Click on image to enlarge)

NXP Semiconductors Price Chart
- The NXPI D1 chart shows price between its ascending 38.2% and 50.0% Fibonacci Retracement Fan levels.
- It also shows NXP Semiconductors breaking down below its horizontal resistance zone.
- The Bull Bear Power Indicator is bearish with an ascending trendline.
My Call on NXP Semiconductors
I am taking a long position in NXPI between $205.14 and $222.22. NXPI has a history of double-digit earnings-per-share growth, and I like the well-diversified business model at current valuations. Short-term volatility could rise, which would provide a superior entry level.
More By This Author:
Weekly Forex Forecast - Sunday, Oct. 19
Forex Today: Gold Make A New All-TIme High At $4,242
Forex Today: Gold, Silver Make New Record Highs
Risk Disclaimer: DailyForex will not be held liable for any loss or damage resulting from reliance on the information contained within this website including market news, analysis, trading signals ...
more


