Weekly Forex Forecast - Sunday, Oct. 19
Image Source: Unsplash
Fundamental Analysis & Market Sentiment
I wrote on the 12th October that the best trades for the week would be:
- Long of Gold. This rose by 5.88% over the week.
- Long of Silver. This rose by 3.15% over the week.
- Long of Platinum following a daily (New York) close above $1,666. This set up on Thursday, but unfortunately the price fell by 6.56% on Friday.
- Long of Palladium following a daily (New York) close above $1,468. This set up on Monday, but unfortunately the price fell by 0.60% over the rest of the week.
These trades produced an overall gain of 1.87%, equal to 0.47% per asset.
A summary of last week’s most important data (some US releases were postponed due to the ongoing government shutdown in the USA):
- UK GDP – a month-on-month increase of 0.1% as widely expected.
- Australian Employment Change – fewer new jobs were created than were expected.
- Australian Unemployment Rate – this unexpectedly rose from 4.3% to 4.5%, but this had little effect on the Australian Dollar.
Last week’s data releases had very little to do with the dominant themes in the market last week. The big issue remains the USA/China trade dispute and the 100% tariff that President Trump has announced will be imposed on all imports from China starting on 1st November, which is now less than two weeks away. Although Trump made light of the initial threat at the start of last week, strongly intimating that all would be well and the rare earths restrictions would be eased for tariff flexibility in return, feelings about this ebb and flow in the market. It is causing nervousness and volatility. We saw quite a large drop in the US stock market, although it recovered much of its loss by the end of the week. We also saw very large sudden drops in precious metals, although this is likely unrelated.
Another area where there is volatility is in the Japanese Yen, which made strong gains before giving much of them up on Friday, most notably against commodity currencies. The Japanese Finance Minister Katsunobu Kato stated that “authorities should monitor risks and guard against excessive exchange-rate volatility that could hurt the economy.” This suggests the Japanese financial establishment is worried about more volatility in the Yen, as they must be thinking it is likely to get even more volatile in the lead-up to 1st November and the new tariff, unless a deal with China is made. If US stock markets sell off sharply, we will likely see flow rush into the Yen as a safe haven. So, all eyes will be on Trump for comments about this over the coming week.
The US government shut down goes on but is having little effect, although it does mean we are not getting much US economic data. We are due a highly important US CPI (inflation) print Friday, if this is postponed it might start to trigger speculation about the data because the market wants and needs this cue.
The bullish trend in Gold has survived, but many trend followers were knocked out of their long Silver trades due to the big fall seen in the price on Friday. Palladium also suffered a very steep fall.
The Week Ahead: 19th– 24th October
The coming week might see more activity in the market, but this will almost certainly be due to the new tariff war between the USA and China, as there are few high-impact data events scheduled for the coming days.
This week’s most important data points, in order of likely importance, are:
- US CPI (inflation)
- US, German, British Flash Services & Manufacturing PMI
- UK CPI (inflation)
- Canadian CPI (inflation)
- New Zealand CPI (inflation)
Due to the ongoing government shutdown in the USA, US data may be postponed indefinitely.
Monthly Forecast October 2025
(Click on image to enlarge)

Currency Price Changes and Interest Rates
For the month of October 2025, I forecasted that the EUR/USD currency pair would rise in value. Its performance so far this month is shown in the table below.

October 2025 Monthly Forecast Performance to Date
Weekly Forecast 19th October 2025
I made no weekly forecast last week.
Although there were notably larger price movements in the Forex market two weeks ago compared to recent weeks, there were still no unusually large price movements in currency crosses last week, so I have no weekly forecast this week.
The Swiss Franc was the strongest major currency last week, while the US Dollar was the weakest, although the numbers were so low as to be almost meaningless. Directional volatility was very low compared to the previous last week, with no major pairs and crosses changing in value by more than 1%.
Next week’s volatility is quite likely to increase.
Technical Analysis
Key Support/Resistance Levels for Popular Pairs
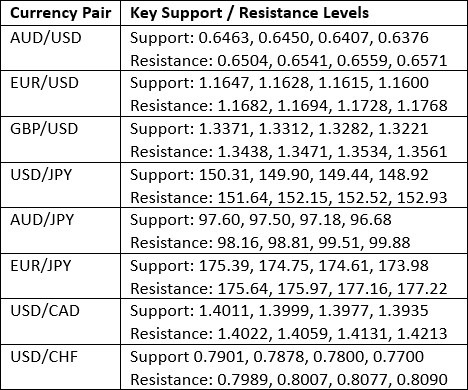
Key Support and Resistance Levels
US Dollar Index
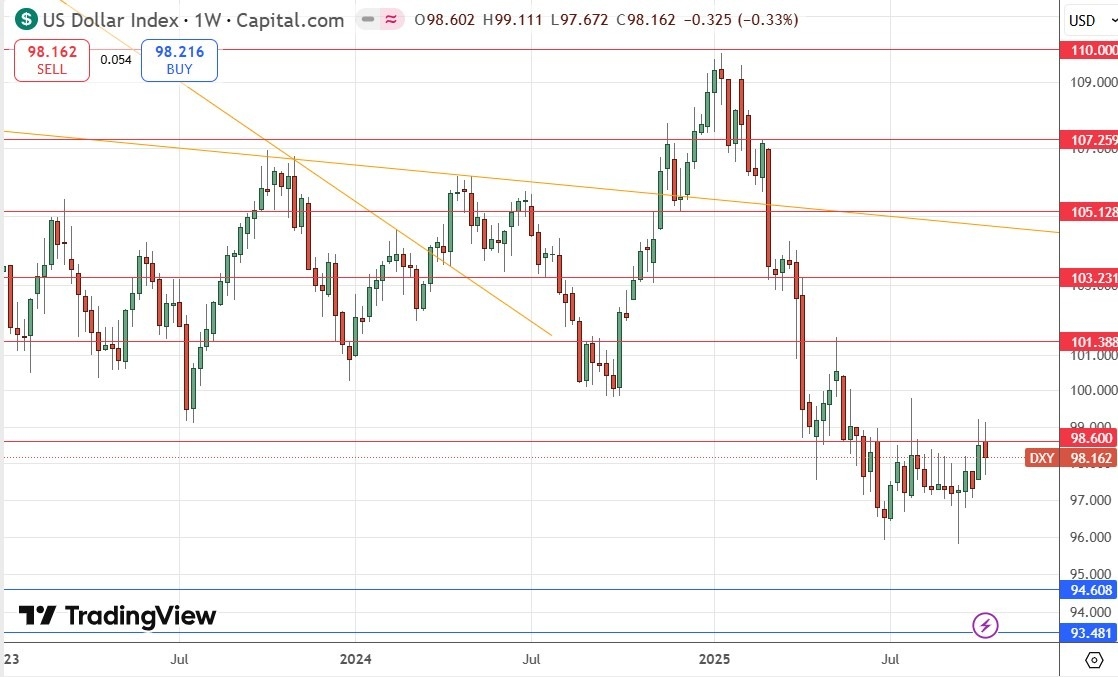
Last week, the US Dollar Index printed a bearish inside bar pattern with significant wicks on both the upper and lower side. However, what is most significant here is the fact that the price has again rejected the key resistance level at 98.60. If we do eventually get a breakout above this level by the US Dollar, we have already seen a real bottom put in so this could be the start of a major long-term upwards trend. Despite being just below its level of 26 weeks ago, the price is above where it was 13 weeks ago, so by my preferred metric, I can declare the long-term bearish trend is over. This places the US Dollar in an interesting position and very close to technically starting a new long-term bullish trend.
The Dollar may take a hit over the coming days if China does not back down over its proposed rare earth export restrictions in the face of President Trump’s 100% China tariff threat, but this situation is producing much more predictable movement in other currencies such as the Australian and New Zealand Dollars (heavily linked to the Chinese economy) and the Japanese Yen (the current haven currency of choice). The Canadian Dollar, as a proxy for Crude Oil, is also sensitive to perceived changes in risk-on demand.
(Click on image to enlarge)
US Dollar Index Weekly Price Chart
USD/JPY
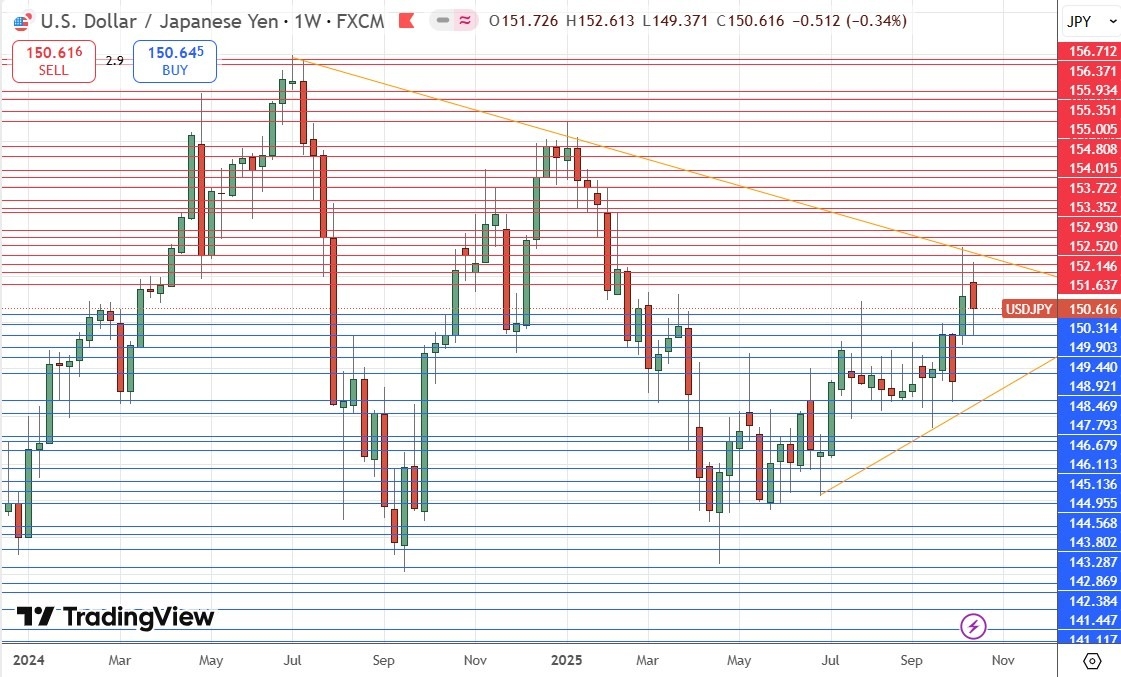
The USD/JPY currency pair weekly chart printed a large, bearish inside candlestick. However, I see it as indecisive and not especially bearish. We have a bullish long-term trend which was triggered by a recent breakout to a new 6-month high price, and such breakouts in this currency pair have historically tended to give traders a trend-following edge.
The issue is really the Yen, which makes big swings depending upon the risk outlook, or more particularly, the outlook on the new 100% tariff President Trump is threatening China with. If the tariff goes away, fully or mostly, via some deal China is willing to do on rare earths, this currency pair goes shooting higher. If the tariff actually happens, or mostly happens, there will probably be a strong price movement in the opposite direction. So, we have a trend, but it as the mercy of politicians. Still, we should remember that “accidents tend to happen along the line of least resistance”, as Jesse Livermore explained, and this is why I am long here.
Note the very long-term consolidating triangle pattern we see, shown by the trend lines which I have drawn within the price chart below. This suggests that a bullish breakout to a new multi-month high could have the legs to run all the way to at least the ¥155 area.
(Click on image to enlarge)
USD/JPY Weekly Price Chart
S&P 500 Index
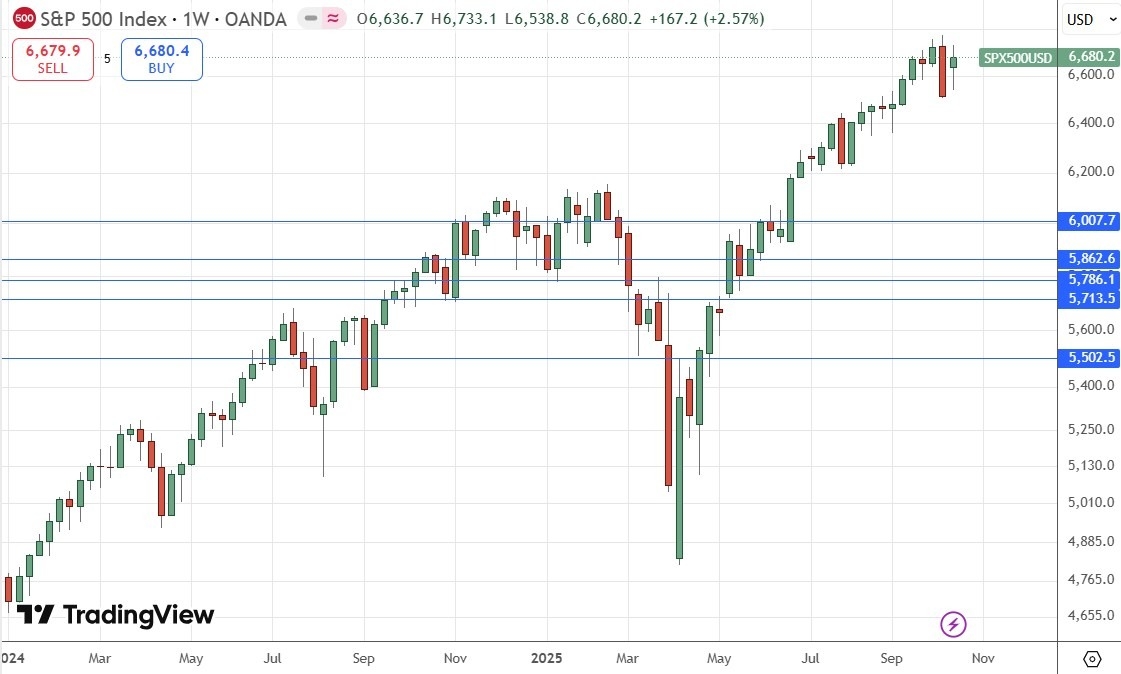
After dropping very strongly on Friday the previous week as President Trump made his big tariff threat against China, the price action was weakly bullish here almost every day this week, suggesting that risk appetite is actually holding up, if not especially strongly. The price is not far from the all-time high made during the previous week.
The short-term outlook here will depend upon the outcome of Trump’s new tariff and China’s rare earth export policy changes. If all goes well and industry gets what it wants (i.e. the removal of both), we can expect the stock market here to rise to new all-time highs. If the outcome is worse, the market will probably fall heavily, potentially extremely heavily in the unlikely event that a new 100% tariff is imposed on China starting 1st November.
I remain long and think it would be wise to wait for a new record high daily close before entering any new long trade, at or above 6,766.
(Click on image to enlarge)
S&P 500 Index Weekly Price Chart
NASDAQ 100 Index
Everything I wrote above about the S&P 500 Index also applies to the NASDAQ 100 Index, but it is worth noting that the NASDAQ 100 outperformed the S&P 500 last week, and the price chart shown below is more bullish, with a more bullish weekly close even nearer to its recent all-time high.
The tech-base index’s outperformance against the broader market suggests that markets believe China will make a deal about its rare earths exports.
I also remain long here and think it would be wise to wait for a new record high daily close before entering any new long trade, at or above 25,187.
(Click on image to enlarge)
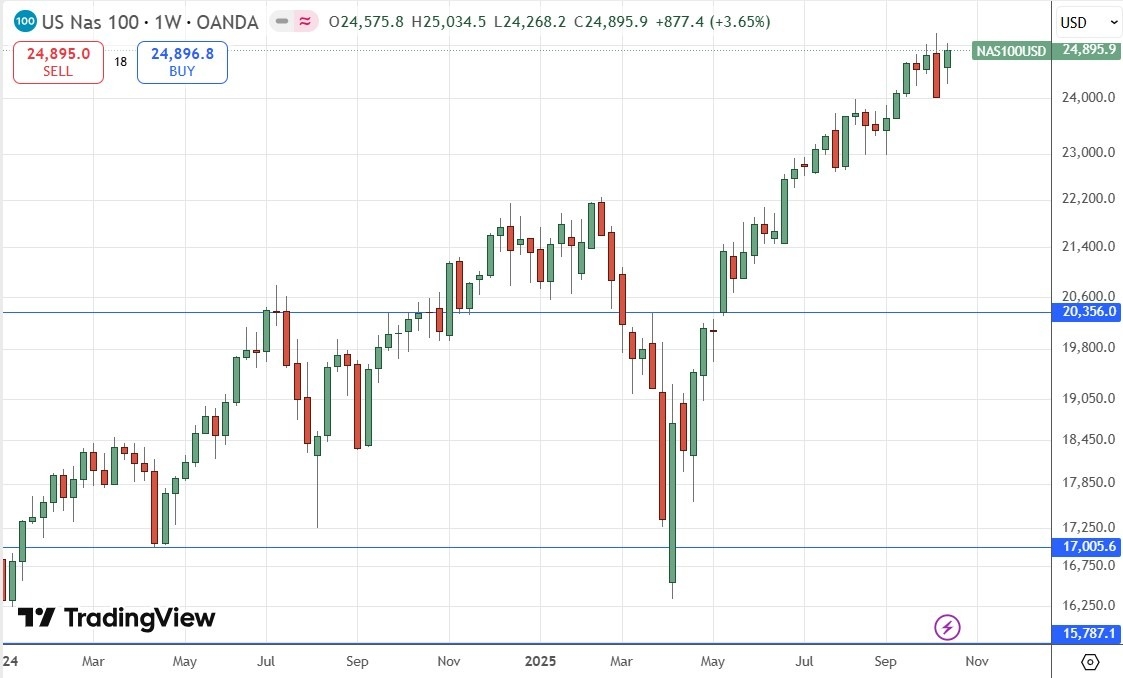
NASDAQ 100 Index Weekly Price Chart
XAU/USD
Gold saw another spectacular rise last week, at one stage it was up by more than 7%, to rise to print a new all-time high, but gave up some of its gain to close up by more than 5%. This weekly rise was the largest seen in Gold in quite a while.
The long-term bullish trend and break to new record highs are bullish factors, but the strong drops we saw in Silver and Palladium, and the extremely high recent volatility, suggest we might be approaching a climax to this bullish trend. After these meteoric gains, how much higher can Gold go?
A bullish factor here is that Gold has held up better than any other precious metal.
I remain bullish on Gold, but it might be wise to only enter a new long position following a new all-time record high close in New York, at or above $4,326.
(Click on image to enlarge)
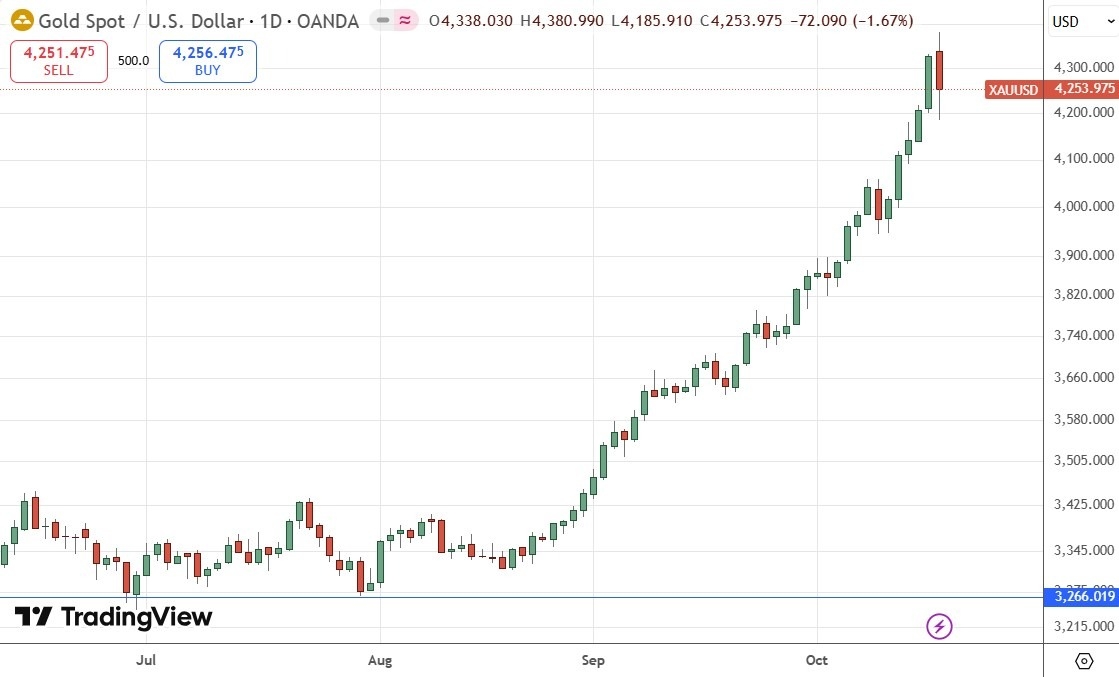
XAU/USD Weekly Price Chart
XAG/USD
It’s a crazy situation that in the same week where Silver rises to close at a new record high weekly closing price, it falls by enough in one day to shake out most trend traders from this exceptionally profitable multi-month long trade. Yet this very large volatility and the generally volatile nature of the price of Silver should be respected. It is also worth noting that other precious metals, notably Palladium, also suffered sharp drops on Friday.
Some will remain long here, but my gut feeling is that we may well not see new highs any time soon, although some kind of weak bullish move is quite possible next.
I exited my long trade and will not be entering another one unless we get a daily close in New York at or above $54.25 – and even then, I won’t be very optimistic about it.
(Click on image to enlarge)
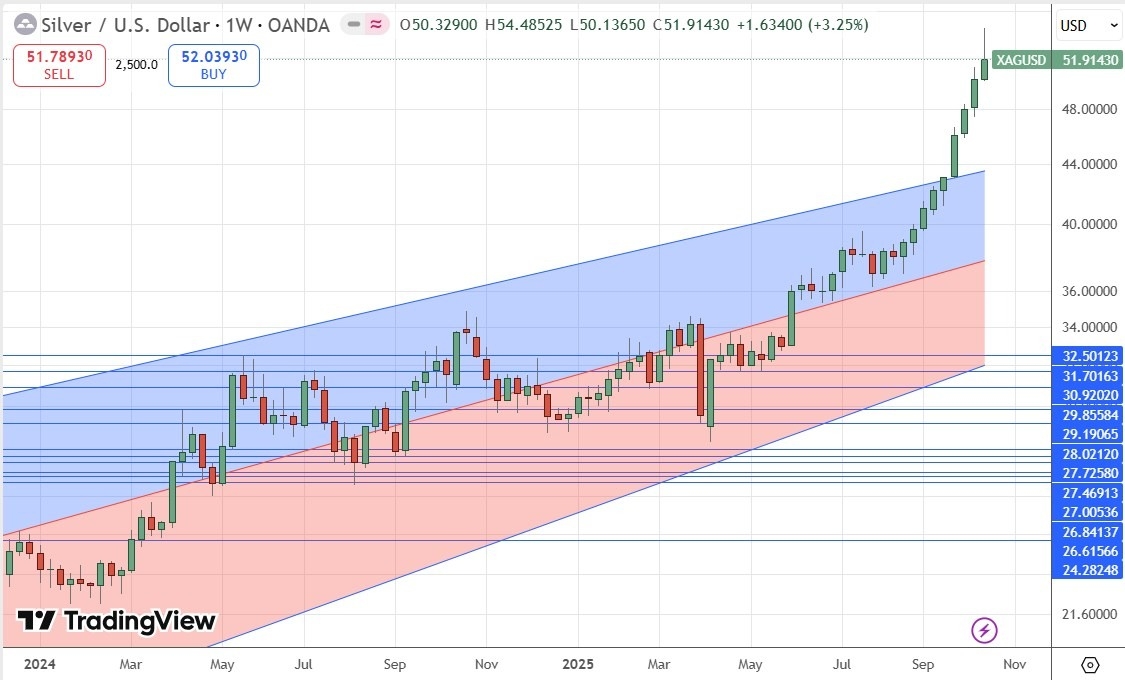
XAG/USD Weekly Price Chart
Platinum
Platinum behaved a lot like Silver last week, rising to a new long-term high Thursday and closing very bullishly, before dropping like a stone along with Silver on Friday. In some ways, the bearish move here on Friday was even worse than Silver’s because there was no late recovery – just a close right on the low.
The weekly price chart below shows very bearish price action hidden without drilling down to the daily chart, which shows two consecutive daily bearish pin bars at the end of the week. Even the weekly chart shows a bearish pin bar. This kind of multi-time frame bearish confluence can be a powerful short signal, and this is another reason why I am not confident about the fate of my existing long trade.
Friday’s decline was not far from 3X ATR (100) which is the typical stop used by trend-followers, so I remain long, but I expect that I will be stopped out on Monday. This precious metal has been on a great run over the past few weeks, probably helped by the amazing long-term bull markets in Gold and Silver.
I think that entering a new long trade would only be a good idea if we get another long-term high New York close, at or above $1,716. However, even if this sets up, I would not be very optimistic that it would be a profitable trade.
If your broker does not offer Platinum, and Platinum futures are too big for you, there is a Platinum ETF offering exposure (PPLT).
(Click on image to enlarge)
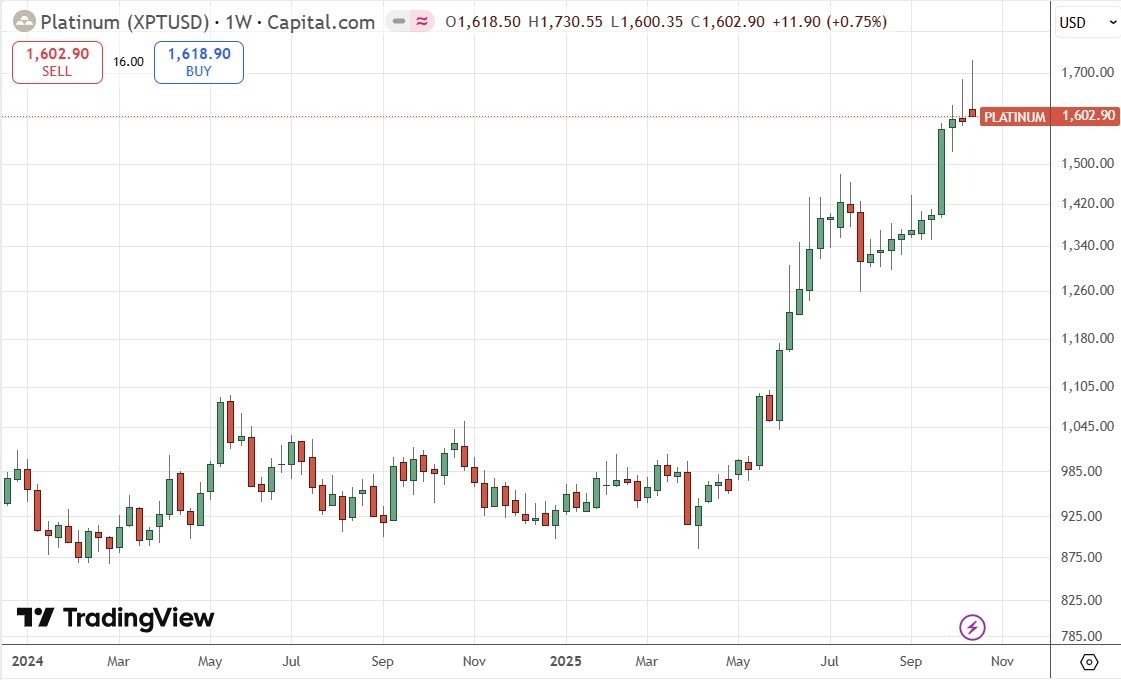
XPT/USD Weekly Price Chart
Bottom Line
I see the best trades this week as:
- Long of the USD/JPY currency pair following a New York close above ¥153.08.
- Long of Gold following a daily (New York) close above $4,326.
- Long of Silver following a daily (New York) close above $54.25 with a small position.
- Long of Platinum following a daily (New York) close above $1,716 with a small position.
- Long of the NASDAQ 100 Index following a daily (New York) close at or above 25,187.
- Long of the S&P 500 Index following a daily (New York) close at or above 6,766.
More By This Author:
Forex Today: Gold Make A New All-TIme High At $4,242
Forex Today: Gold, Silver Make New Record Highs
Forex Today: Stocks Rebound; Gold, Silver Hit Record Highs
Risk Disclaimer: DailyForex will not be held liable for any loss or damage resulting from reliance on the information contained within this website including market news, analysis, trading signals ...
more


