

Image Source: Unsplash
Market Brief – Employment Sends Rate Cut Odds Surging
The August employment report painted a clear picture of a cooling U.S. economy. Employers added just 22,000 jobs, far below consensus expectations, signaling that hiring momentum has slowed. Even more troubling, June was revised to show a loss of 13,000 jobs, the first monthly contraction since 2020. Meanwhile, unemployment rose to 4.3%, its highest level in nearly four years. Job gains were concentrated in healthcare, while manufacturing and federal employment weakened further. Layoffs also surged, with about 86,000 job cuts announced in August, the largest total for that month since the pandemic years.
This weakness has several implications. First, it points to slowing economic growth as companies curb expansion and trim payrolls. Second, and more notably, a softer labor market reduces upward pressure on wages. That, in turn, eases one of the stickiest drivers of inflation. As wage growth cools alongside weaker hiring, consumer demand could moderate further, lowering inflationary pressures in the months ahead. That will give the Federal Reserve additional cover to shift from its more restrictive stance and join into the rate cutting race that is already happening globally.
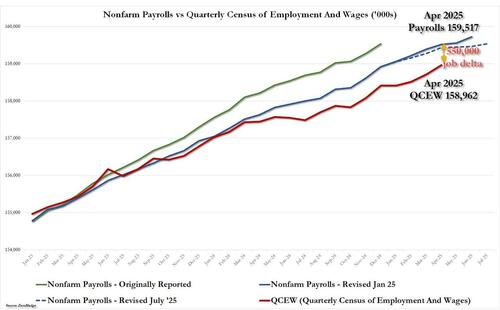
Next week, on Tuesday, we will also get the annual revisions to the BLS employment report. That adjustment will likely show that over the last 12-months somewhere between 550,000 to 800,000 fewer jobs were created than originally reported based on the QCEW report.
The bond market responded as expected. Bond yields fell as investors realized the disinflationary impact of slower employment and wage growth would increase recession risk. If the revisions to employment show a substantially weaker than expected outcome, bond yields will likely fall further.
(Click on image to enlarge)
But looking forward, the market faces a tug-of-war. Historically, lower interest rates support higher equity valuations by reducing discount rates and improving liquidity. However, slower economic growth directly pressures corporate earnings, particularly in cyclical sectors tied to consumer spending, manufacturing, and capital investment. If earnings revisions trend lower, the risk of the market questioning high forward valuations will increase.
Just a risk worth considering.
Outlook: Markets may remain volatile in the near term as monetary easing collides with weakening fundamentals. The balance of risks suggests that earnings deterioration could eventually outweigh the initial rate-cut optimism.
Technical Backdrop
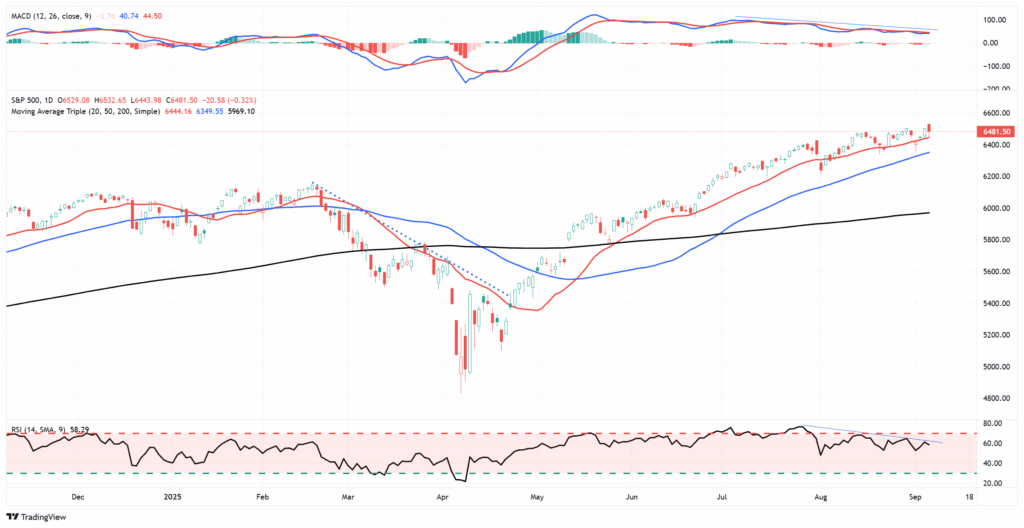
The S&P 500 closed at 6,481.50 after hitting a record high earlier in the week. Momentum indicators remain supportive of further gains. The 14-day RSI sits near 58 and remains in a negative divergence with the market. At the same time, as the market trends bullishly, the risk of a corrective/consolidative period increases as relative strength erodes. The MACD further confirms that outlook, which suggests momentum is slowing. While there is a cluster of buying support at current levels, a break below the 50-DMA (~6350) will likely find a lack of buyers until the 200-DMA at ~6000.
(Click on image to enlarge)
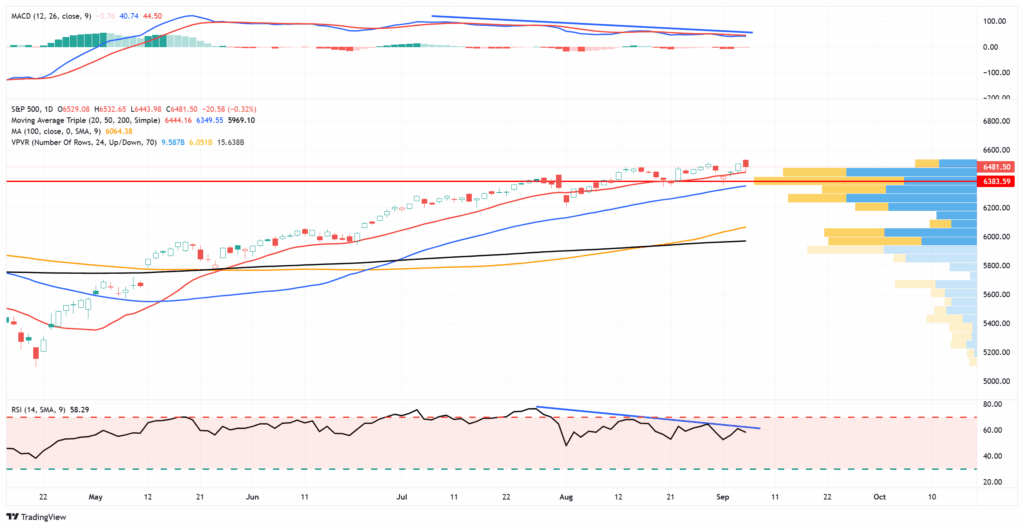
However, the bullish bias remains for now. The index continues to trade above its 20-, 50-, and 200-day averages, and crossover signals from short- and medium-term moving averages confirm trend strength. Breadth also
appears healthy, with multiple sectors participating in the advance, including technology, financials, and housing, which is an encouraging sign.
At the same time, traders should remain mindful of possible short-term headwinds, particularly as we move past mid-month, when corporate share buybacks will return to “blackout.” As noted above, with economic data already weak and seemingly getting weaker, a more substantial market risk remains earnings outlooks. If earnings estimates start to be revised lower, the valuation multiple currently paid by investors may be questioned. Still, the broader technical backdrop remains positive, and strong sector participation suggests that any dip is likely to be shallow rather than the start of a deeper correction.
Key support levels now sit at the 6,444 area (20-day moving average) and 6,350 (50-day moving average), which should provide near-term buying interest if tested. A break below the 6,350 level would open the door to a deeper retracement toward 6,000 (200-day moving average), though that level remains distant given current strength. On the upside, the immediate resistance lies at 6,525–6,550, the zone of recent intraday highs. A breakout above that range could target 6,600 as the next psychological milestone.
Outlook: The S&P 500 looks poised to extend its rally into next week, but traders should expect potential consolidation between 6,420 and 6,525 before a push toward 6,600.
Key Catalysts Next Week
Markets enter the week awaiting inflation and labor signals as the Fed’s blackout period approaches. With markets firmly pricing in a 25-basis-point rate cut at the September 16–17 FOMC, any surprises in core inflation or labor momentum, especially via PPI, CPI, or jobless claims, could swing sentiment sharply. Traders will closely watch these numbers to gauge whether the Fed will proceed cautiously or accelerate easing.
(Click on image to enlarge)
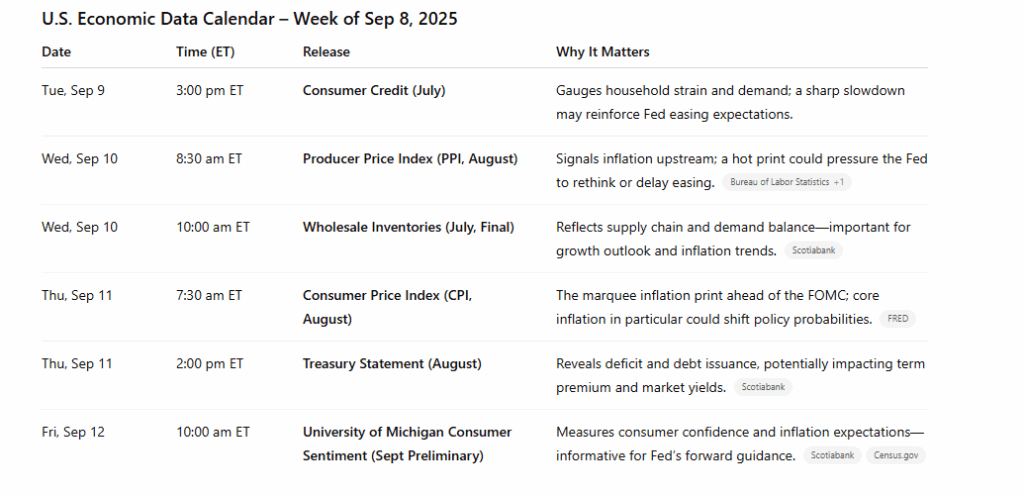
The week ahead centers on inflation dynamics, with PPI on Wednesday and CPI on Thursday, against a backdrop of consumer credit trends and confidence. Elevated PPI and CPI readings could delay or derail rate-cut expectations, while softer figures may embolden markets toward easing. Wholesale inventories and Treasury issuance data will add texture to supply-demand and financial conditions. All eyes now turn to these prints for the Fed’s September policy path.
Outlook: Inflation remains the x-factor this week. Soft data should cement market bets on a September rate cut, while upside surprises in PPI or CPI could give markets pause and force a re-evaluation of Fed timing.
Need Help With Your Investing Strategy?
Are you looking for complete financial, insurance, and estate planning? Need a risk-managed portfolio management strategy to grow and protect your savings? Whatever your needs are, we are here to help.
Using MACD To Manage Portfolio Risk
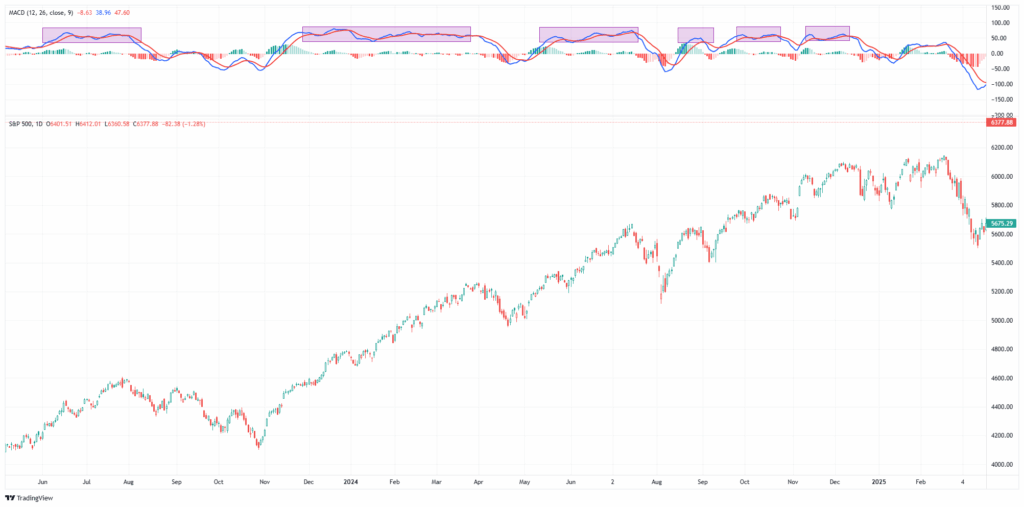
On Monday, I posted an article discussing the “hard truth” about portfolio risk management. In that article, we discussed position risk sizing, stop losses, etc., but didn’t discuss the role of technical indicators, such as using MACD to help identify periods of increased risk. MACD, short for Moving Average Convergence Divergence, is one of the market’s most widely used technical indicators. It helps assess price momentum and signal potential trend reversals. While no indicator works perfectly, using MACD can be valuable when paired with other tools.
Let’s start with the basics. The MACD calculation subtracts a longer-term exponential moving average (typically 26 periods) from a shorter one (usually 12 periods). This creates the MACD line. A 9-period EMA of the MACD line is then plotted as the “signal” line. When the MACD line crosses above the signal line, it may suggest bullish momentum is building. A cross below the signal line may warn that bearish momentum is strengthening. The chart below shows the MACD of the S&P 500 Index. As you will notice, the MACD can remain elevated for an extended period before turning sharply lower. Those periods of high momentum often serve as a good indicator that investors should consider reducing portfolio risk before the eventual downturn occurs.
(Click on image to enlarge)
Most charting software includes a histogram in addition to these lines (as shown above). That histogram shows the difference between the MACD and its signal line. Positive bars suggest increasing bullish momentum, while negative bars indicate growing bearish pressure. The height and direction of the histogram bars reflect the degree of momentum shift. Analysts often use exponential moving averages to give greater weight to recent price action. This makes using MACD more sensitive to current conditions, which can be helpful in our current fast-moving markets.
However, as shown above, using MACD is not foolproof as it can produce false signals. This is especially true in a range-bound or whipsaw market. The MACD might flash multiple buy and sell signals without a clear trend in these instances. As shown, that is currently the case, which makes portfolio risk management more frustrating. That’s why it should never be used alone. Confirm signals with broader trend analysis, support/resistance levels, or other momentum indicators like RSI (relative strength index).
The chart below shows the current MACD, which has not given a strong signal to reduce risk. However, as noted above, the negative divergence in the MACD and RSI suggested that investors should reduce portfolio risk. These negative relative strength and momentum divergences tend to precede corrective market periods.
(Click on image to enlarge)
Also, MACD readings are more meaningful from historically high or low levels. A bullish crossover near historical lows may carry more weight than one near neutral. To identify these extremes, look at MACD behavior over two to three years.
As noted, using MACD assists in structured decision-making; it is not an absolute, standalone tool. Therefore, as noted, the MACD indicator should be used within the context of other tools to help identify trends, risks, and what portfolio management actions to take. Interpreting the MACD in the proper context is what separates disciplined risk management from blind speculation.
Portfolio Risk Management Relative to the Market
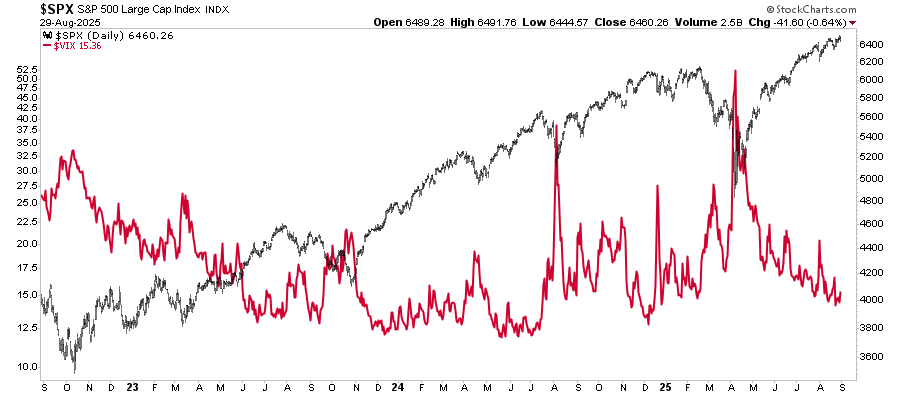
The strength of August’s rally surprised many. As we noted previously, historically speaking, August tends to show weakness or sideways action. But this year, dovish language from the Federal Reserve and broad-based risk-on sentiment kept buyers in control. However, Portfolio risk management doesn’t live in a vacuum. You must manage it relative to the broader market.
To do that, you need to use volatility as a key input. The VIX sat in the 15 to 18 range in July 2025. That’s low. But low doesn’t mean safe. Low volatility often signals complacency. When volatility is cheap, it pays to buy insurance.
(Click on image to enlarge)
Likewise, investors must separate perceived risk from actual risk. Volatility may feel like danger, but it is often simply price movement around a trend. Actual risk lies in permanent capital loss, overconcentration, or misalignment with one’s time horizon and objectives.
As we discussed previously, volatility begets volatility. Periods of low volatility always lead to high volatility, like now. However, the opposite is also true. The trick is navigating the periods of high volatility well enough to participate in the extended periods of low volatility. Ray Dalio, founder of Bridgewater Associates, advocates for a similar analytical approach to risk:
“If you’re not worried, you need to worry. And if you’re worried, you don’t need to worry.”
In other words, constant vigilance and preparation are more productive than panic. Investing during periods of uncertainty can be dangerous; however, there are some steps to take when investing in uncertain markets. Furthermore, this is where using MACD can provide help. While the market was sitting at all-time highs at the end of August, the MACD had been showing weakness in overall market momentum, which is occurring with margin debt expanding more sharply. These red flags are worth paying attention to and suggest market fragility.
The question investors should ask themselves in the current market environment is rather simplistic: “Is my portfolio positioned for how the market behaves now rather than how I think it should behave?”
That humility protects your capital.
Currently, Wall Street remains divided on where the S&P goes next.
- Evercore ISI sees the index climbing as high as 7,750 by the end of 2026. Their view rests on expanding AI investment, rising productivity, and a softening Fed.
- In contrast, Societe Generale warns that bubble dynamics will form if valuations stretch much further. SocGen also cites high concentration risk and overly optimistic earnings assumptions.
- J.P. Morgan takes a more neutral view, expecting the index to end 2025 around 6,000.
- Bank of America has published a long-term scenario where the S&P 500 could approach 9,900 by 2027 if monetary conditions stay loose and earnings growth accelerates.
The problem is they don’t have any better idea of where the market will be next week, much less next year. However, this kind of forecast dispersion signals risk. When sentiment ranges from euphoric to cautious, technical tools like using MACD become more critical. They provide a lens into market momentum that can’t be seen in forecasts alone.
In this environment, the MACD has remained primarily in bullish territory, with shallow retracements in April and July followed by positive momentum signals. However, recent price action shows early signs of divergence, with momentum slowing even as the price pushes higher. That’s often a good hint that risk management protocols should be implemented.
Applying MACD For Risk Control
Using MACD effectively means integrating it into a broader risk management framework. MACD measures momentum shifts at its core, but how you respond to them defines whether you manage risk or chase performance. However, there is a relatively simple framework you can apply to your own portfolio risk management.
- Start by watching for clean MACD crossovers on daily charts. A move above the signal line, especially when MACD is below zero, may offer a more reliable long entry. But be cautious when crossovers occur repeatedly during choppy, sideways price action. These are more likely to be noise than signal.
- Equally important is watching for divergence. If the S&P 500 continues to push higher, but MACD peaks begin trending lower, that’s a red flag. It means momentum no longer confirms price, suggesting the rally could lose steam. This is where tightening stops, reducing exposure, or scaling out of positions becomes essential.
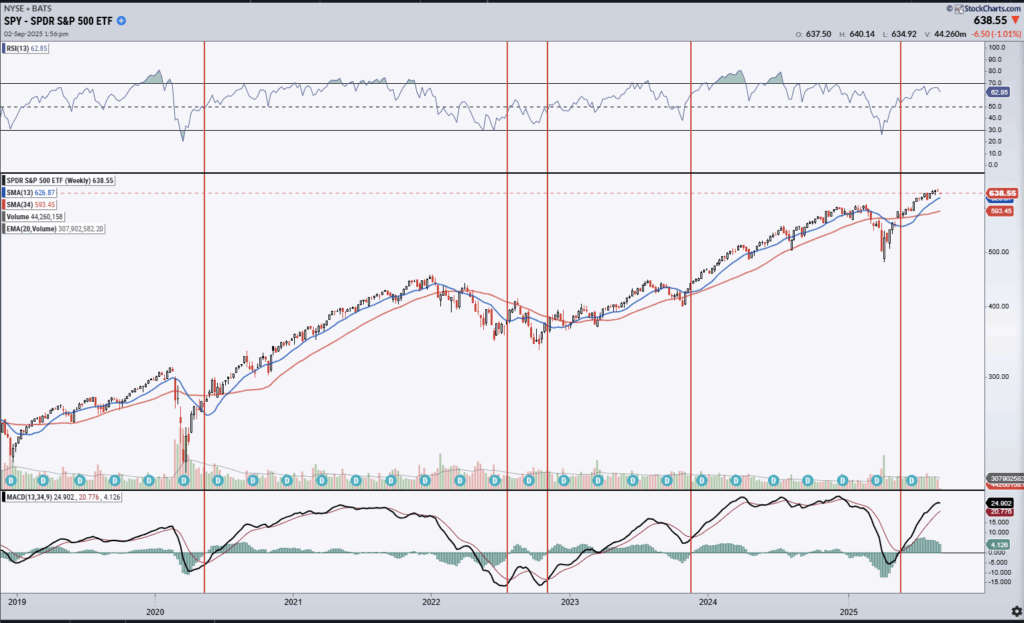
- For longer-term positioning, weekly MACD signals can help filter out daily noise. Weekly MACD gave solid buy signals in late 2022 and mid-2023. It currently shows flattening momentum, not outright bearishness, but less conviction. Sell signals on weekly MACD tend to come late, so use them to confirm caution—not to time exact exits.
(Click on image to enlarge)
No signal is infallible, but using MACD can provide a structured lens into trend strength, exhaustion, and reversal potential. Most importantly, combine it with other tools in your arsenal, such as price patterns, volume, sentiment, or fundamentals, to avoid overreacting.
Right now, momentum remains mostly intact. But divergence is forming. Let the market confirm direction. In the meantime, tighten your process, stay selective, and manage position size. That’s how you reduce drawdown risk—and preserve long-term capital.
I hope this helps.
Portfolio Tactics – Trading September Weakness?
September often delivers disappointing returns for equity investors. Historically, it’s the weakest month for the S&P 500, averaging a decline of nearly 1% from 1950. This seasonal weakness stems from multiple factors, but the risks look more acute this year. The corporate buyback window is closing, reducing a significant source of consistent demand. At the same time, institutional managers will begin quarter-end rebalancing. That process often involves selling equities to lock in gains and reallocate into underperforming asset classes like bonds or cash. With markets not far off from all-time highs and breadth narrowing under the surface, the setup for a drawdown is present. September won’t guarantee a correction, but conditions warrant tightening risk.
Here are seven actions investors should consider now:
- Rebalance equity exposure. Trim overweight positions in tech and large-cap growth stocks that have led the rally. Reallocate toward more defensive sectors or cash equivalents.
- Raise cash. Take profits from extended positions and increase cash levels to reduce portfolio volatility and create flexibility for future opportunities.
- Review stop-loss levels. Tighten stops on high-beta or speculative names. Don’t let short-term volatility erase year-to-date gains.
- Monitor MACD and RSI indicators. Use technical tools to identify momentum deterioration and confirm trend changes before shifting allocations.
- Evaluate fixed-income opportunities. Consider reallocating capital into short-duration Treasuries or high-quality bonds to take advantage of attractive yields amid uncertainty.
- Hedge equity exposure. Use inverse ETFs or put options selectively to hedge downside risk in portfolios exposed to broad-market weakness.
- Prepare a buy list. Identify fundamentally strong names you want to own if prices correct 5–10%. Capital should be positioned to act when value re-emerges.
September doesn’t require panic, but it demands preparation. With seasonal headwinds building, reduced buyback support, and potential asset shifts by institutional managers, it’s a smart time to review exposures and tighten your game plan. Risk happens fast when momentum breaks. Use this window to get ahead of it.
(Click on image to enlarge)

More By This Author:
Fed Policy Is More Restrictive Since Rate Cuts
Why Keynes’ Economic Theories Failed In Reality
Robots Are Tesla’s Future: EVs No Longer The Value Proposition


Comments
Log in or sign up to join the conversation.