
(Click on image to enlarge)
I love consumer instinct.
Thank you, Peter Lynch, for teaching us about using our instincts as consumers along with megatrends and technical analysis.
Last night we went to a dinner party and the conversation turned to Bowling Green, Nebraska, the Ozempic capital of the U.S.
On December 2, 2024, I wrote a Daily called, Novo-Nordisk, A Love Story.
I wrote, “According to an article in the NY Post, the diet drugs have “changed the foods we eat, the ways we celebrate, and exercise, and travel, and dress, and talk about health and beauty.”
It behooves you to investigate which companies are related to the life changing characteristics the article mentions.
I have been on this theme since 2023 and now have it as one of my major investment themes for 2025.”
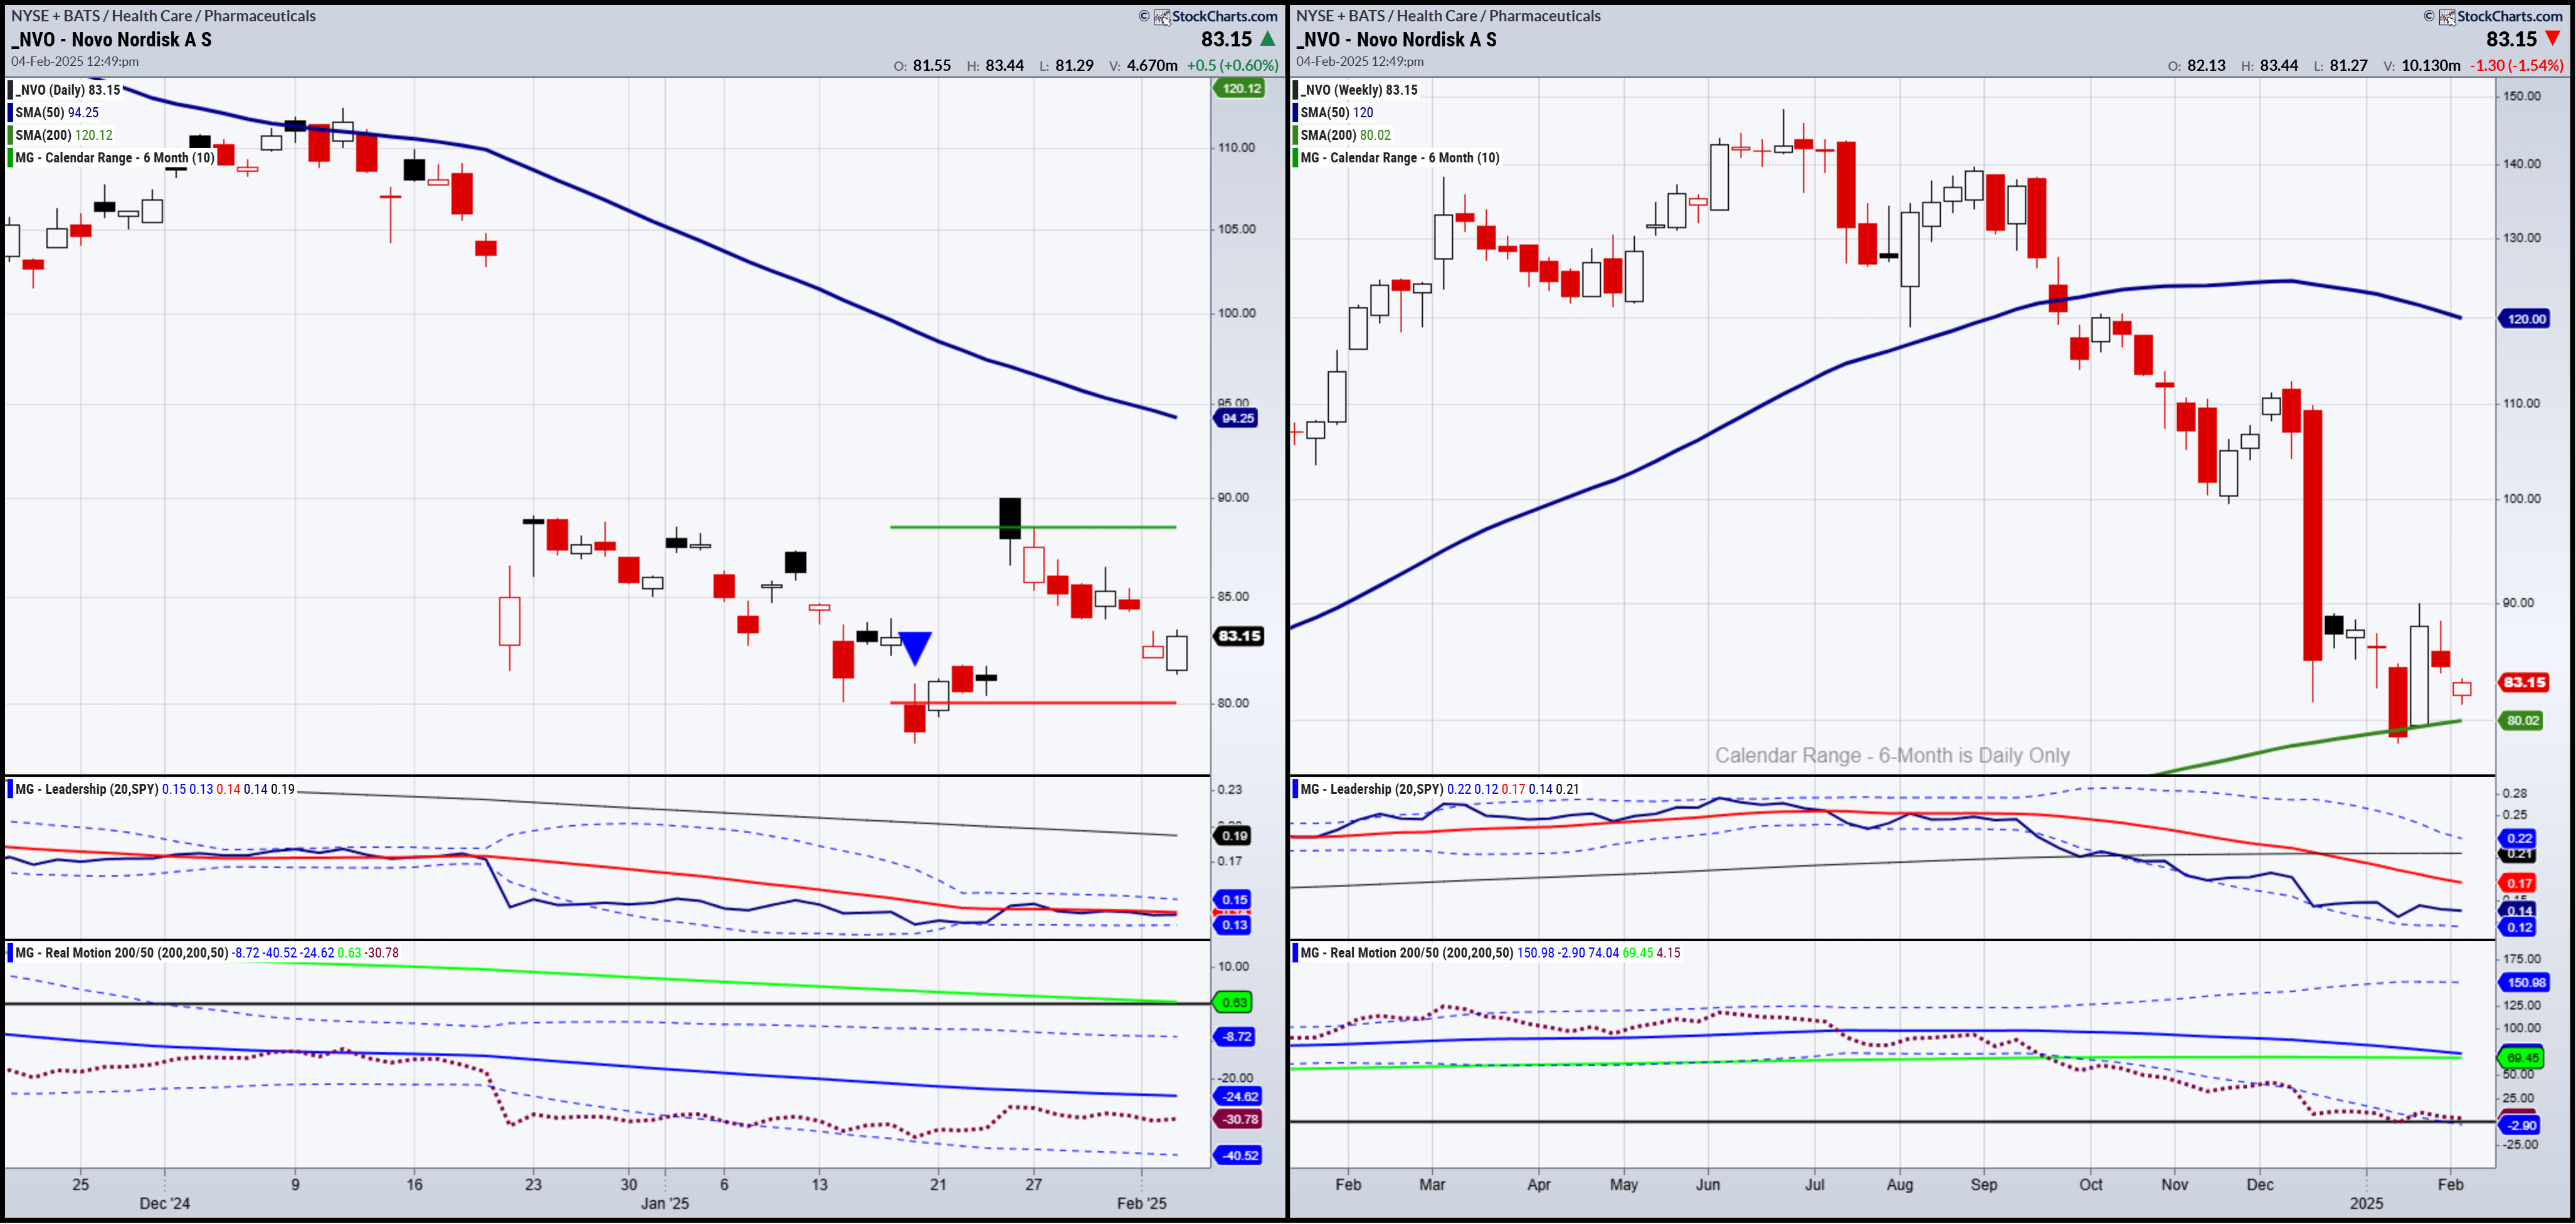
As Novo Nordisk (NVO) recently had positive news on a trial about its impact on kidney disease, the stock then gapped up, and then sold off back to major support.
When folks are talking about the drug at dinner parties, and the fundamentals are intact, we get interested.
It is also possible, NVO is offering us another low-risk trade setup.
The Daily chart shows us that even after the gap higher, the price could not hold above the January 6-month calendar range.
However, the move lower has kept price above the calendar range low.
I like the momentum holding up despite the selloff.
And should NVO get back above 85.00, that would look solid.
On the weekly chart, we can clearly see the risk to under the 200-week moving average.
Plus, in the last 2 weeks, NVO has been trading inside the bar from 3 weeks ago.
The monthly chart has its own narrative.
(Click on image to enlarge)

This chart has the 23-month and 80-month moving averages.
While the price is in the middle of both moving averages, note the relative strength on the bottom of the chart.
NVO on a monthly timeframe is massively oversold.
If you add the low risk illustrated on the weekly chart, along with the rising momentum and calendar ranges on the daily chart, that is compelling enough.
That a hot company with good fundamentals is oversold is yet another reason to keep this one on your radar.
ETF Summary
(Pivotal means short-term bullish above that level and bearish below)
S&P 500 (SPY) 600 super pivotal
Russell 2000 (IWM) 227 is now the area to get back above
Dow (DIA) 439 support 452 now the resistance to clear
Nasdaq (QQQ) 511 area key support 528 to clear
Regional banks (KRE) 64 to clear and 62 to hold
Semiconductors (SMH) 237 support needs to clear and hold over 242
Transportation (IYT) Its all about 68 support and getting back over 70
Biotechnology (IBB) 140 resistance to clear
Retail (XRT) 77 key support resistance to clear 81
iShares iBoxx Hi Yd Cor Bond ETF (HYG) Flashing risk on again
More By This Author:
Compare/Contrast - Year Of The Yin Wood Snake 1965 And 2025
Post FOMC - A Look At Snakes And The Long Bonds TLT
Turnaround Tuesday: Focus On Gold Miners


Comments
Log in or sign up to join the conversation.