
Many are quoting that the Year of the Snake is a bad year for stocks.
However, this is the Yin Wood Snake and a year ending in the number 5.
The last time we saw the Year of the Yin Wood Snake was in 1965.
It makes sense then, to compare and contrast then and now.
Johnson and the Fed
Perhaps the most glaring comparison is that President Lyndon Johnson and the Fed Chairman Bill Martin clashed over policy. Source
Martin raised the discount rate amid signs of an overheating economy, increased government spending (including a war) and a tax cut all leading to raised inflationary warnings signals.
Johnson enraged, was worried that higher rates would slow the economy.
He relented.
What strikes me as the most interesting is that the rate hike of 1965 did not, in fact, turn a corner on inflation.
In the years that followed, fiscal stimulus was ample, war spending kept rising, and the deficit grew.
Also interesting is that The Federal Reserve raised interest rates in response to a gold outflow caused by distrust of the dollar and failures.
The Fed raised the discount rate from 4% to 4.5% in December 1965.
Fast forward..
As of January 30, 2025, the US discount rate is 4.50%, higher than the long-term average of 2.23% and the same as it was in 1965.
The Federal debt in 1965 was $322.3 billion. In 2025 it is at $36.24 trillion. The unemployment rate was 5.2%. Now it is at 4.1%.
In 2025 our debt is 100 times larger, our employment rate is 1% lower and our discount rate is exactly the same.
Tariffs 1965 and 2025
President Trump has declared that he wants the interest rates to be lowered.
He is about to place tariffs on goods from Mexico, China and Canada.
Tariffs existed in 1965 (began in 1789).
President Johnson imposed a 25% tariff on light trucks, such as SUVs and pickup trucks. This tariff was a response to Europe's tax on US chicken imports.
He also amended tariffs in 1965 and 1966 to close a loophole where wool importers escaped higher tariffs by blending reprocessed wool fabrics with small amounts of high value non-wool material.
Johnson was not happy about it and said this,
“I have approved this bill only because an unusual problem-one which has resulted in artificial manufacturing practices by foreign manufacturers and has imposed a high degree of uncertainty on the domestic industry--has existed since 1961 under existing tariff schedules. It remains my firm view that liberal trade policies and efforts to achieve the elimination of barriers to fair trade are in the best interests of our Nation and our trading partners.”
In 2025, tariffs are Trump’s favorite word.
Best interests of our nation?
Remains to be seen.
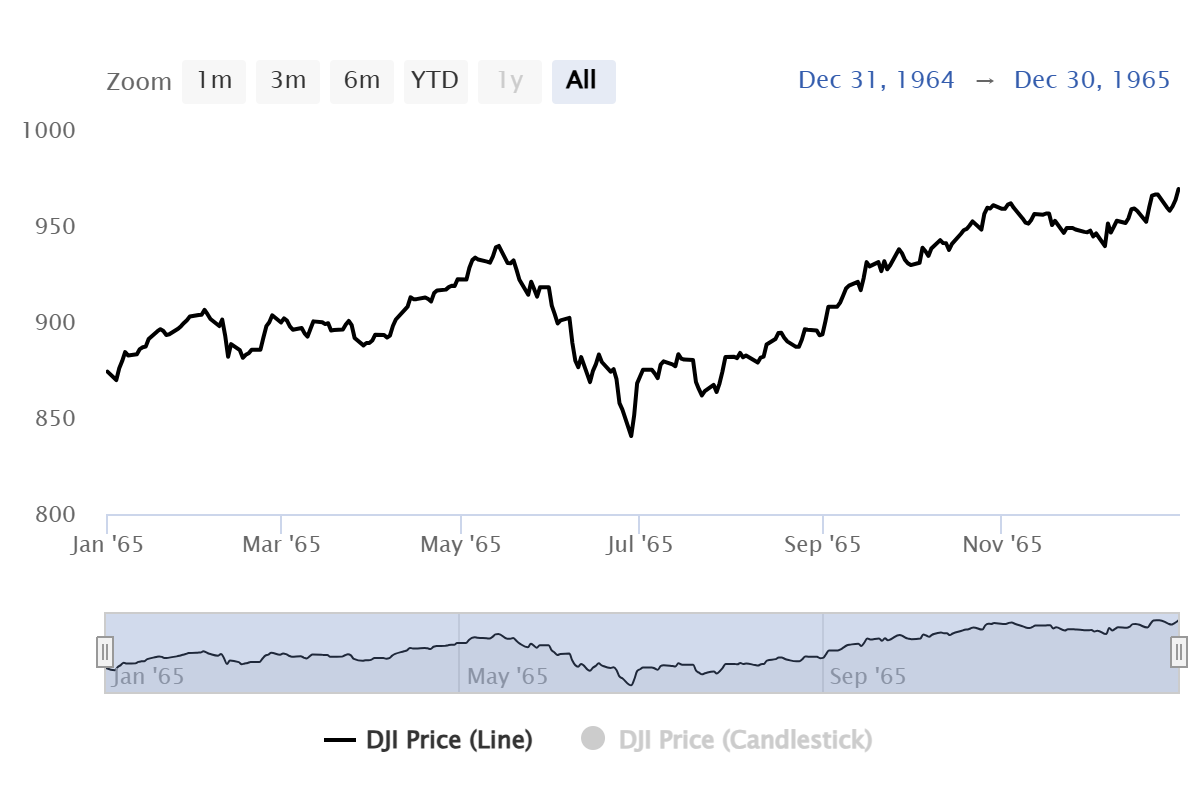
January Trend Trade 1965 and 2025
Looking at the chart from 1965, note that the January trend trade mirrors the one from 2025.
The Dow rose in January, fell in February, peaked in May, fell roughly 13% in July and then went on to make a new yearly high with a gain of 10.88%.
But here’s the rub.
Not only did inflation grow in the ensuing years, but the stock market peaked in February 1966. FOR 30 YEARS! (Although the trough was in 1982 if investors were sharp enough to catch the bottom.)
In 1965 the inflation rate was 1.61% and rose to 5.8% in 1970. Compared to the high inflation rates seen in the 1970s, the inflation levels during the late 1960s were considered moderate.
Our current inflation rate is 2.9%.
If the Fed lowers (which I believe can happen in March), inflation will spike.
If they raise, inflation could still spike.
We still have a lot of unknowns.
But what we do know is that Trump could easily clash with Powell, especially if inflation rises and the economy stagnates.
Many believe that it will be the Fed Chairman and not the President who will relent in 2025.
Nifty Fifty and MAG7
People didn't invest in "the market" during most of this time period--they either bought shares in individual companies, or they trusted a money manager or mutual fund manager to pick companies for them.
Where did most money managers put their client’s money?
The Nifty Fifty was a group of 50 large-cap stocks on the NYSE.
While the Dow stalled in 1966, the 50 known for their consistent earnings growth and high price-to-earnings (P/E) ratios did not fall out of favor until 1973, when many dropped by more than 40% into 1974.
Basically, they outperformed for 6 more years after DJIA peaked.
This is why you have some analysts touting the MAG7 as the only place to invest passively, while other analysts warn of unrealistic investor expectations for growth stocks.
A Broader More Indexed Based Market 2025
The Economic Modern Family did not exist in 1965.
Let’s look at the Family, though, at the end of January 2025.
(Click on image to enlarge)

After Friday’s announcement about tariffs, the market dropped precipitously.
Remember that January 1965 started up and then fell in February.
This measure can only be compared to the DJIA in 1965. There were no sector ETFs.
Nasdaq 100 failed the January calendar range high but closed in better shape than certainly the Family members, yet still down week over week.
Like 1965, growth is performing better.
Calendar Range
The January 6-month calendar range was negated in everyone in the Family you see here. In 1965 that happened in February.
The Russell 2000 IWM, Granny Retal XRT, Biotech (performed the best) IBB, Sister Semiconductors SMH, Transportation IYT and Regional Banks KRE.
The question is, will we repeat 1965?
The good news is that in 1965 the February sell-off was short-lived.
Looking at the Family weekly charts, support levels (50-week moving averages) are intact.
However, as they are now below their January trend trade levels, we should know readily whether the path this Year of The Yin Wood Snake diverges from the one in 1965.
It is possible that everything rallies back this week. Data wise, we will know more about the jobs numbers this coming Friday.
For guidance this week, use the calendar ranges. A move back above those levels will be positive, at least in the short-term.
If the market begins on shaky ground, then we would expect a bigger selloff until the dip buyers return.
Gold is on its own as the ultimate flight to safety.
Keep your eyes on food commodities, oil and silver.
Stagflation seems more plausible but remember, price rules.
ETF Summary
(Pivotal means short-term bullish above that level and bearish below)
S&P 500 (SPY) 600 support
Russell 2000 (IWM) 225-227 is key as an area to hold up
Dow (DIA) 452 now the resistance to clear
Nasdaq (QQQ) Under the Jan range but over the 50-DMA
Regional banks (KRE) 64 pivotal
Semiconductors (SMH) 237 needs to hold
Transportation (IYT) Ugly turnaround and a bit of a warning signal if cannot hold up
Biotechnology (IBB) 137 support 140 next place to clear
Retail (XRT) Needs to get back over 81,then the risk is under 78
iShares iBoxx Hi Yd Cor Bond ETF (HYG) 79.40 the calendar range support
More By This Author:
Post FOMC - A Look At Snakes And The Long Bonds TLT
Turnaround Tuesday: Focus On Gold Miners
DeepSeek Is Not New - The Rotation Away From Tech Is


Comments
Log in or sign up to join the conversation.