Tuesday Talk: New Month, New Highs
Both the S&P 500 and the Dow Jones Industrial Average ended the day with new closing highs on Monday. The Nasdaq Composite also made a good showing and activity in the small caps pulled the Russell 2000 strongly, ahead.
The S&P 500 closed at 4,613, up 8 points, the Dow Industrial Average closed at 35,914, up 94 points and the Nasdaq Composite closed at 15,596, up 98 points. Monday's most actives were across sectors:
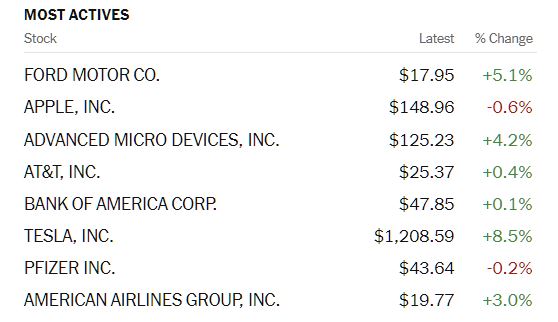
Chart: The New York Times
Currently market futures are mixed; S&P futures up .5 points, Dow futures up 21 points and Nasdaq 100 futures down 22 points.
Contributor Declan Fallon couldn't have been happier at Monday's close, writing that Finally... The Russell 2000 Delivers A Breakout.
"Today could prove to be a very big day for the markets after the Russell 2000 (IWM) showed its first sign of life for 2021. The index managed to take out the 'bull trap', and break to a new closing high. Volume climbed to register as accumulation. "
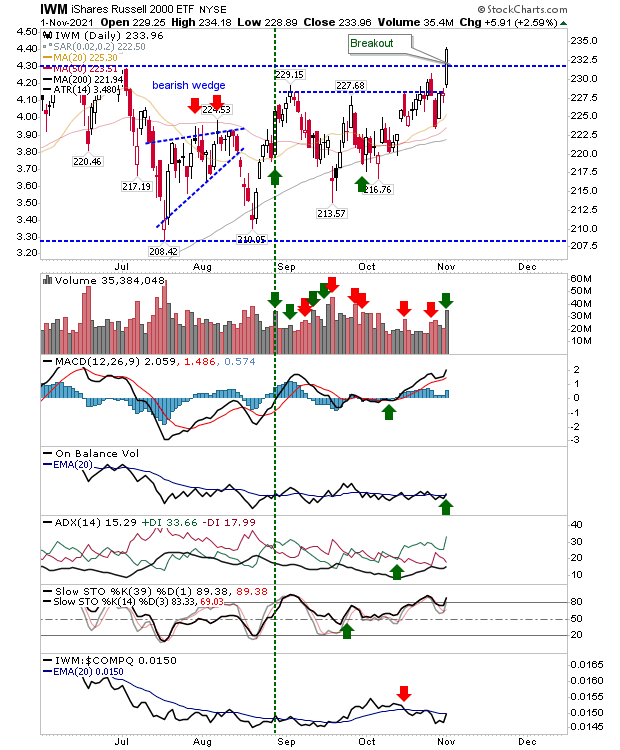
"The breakout in the Russell 2000 finally switched the relative performance away from Large Caps back in favor of Small Caps. While this shift isn't the best news for the S&P, the latter's breakout remains intact and technicals are net positive. The S&P has done much of the leg work over the course of 2021 so now is a good time for change...The week has started well, now it just needs to continue with its positive start with the Russell 2000 holding its new breakout."
See the article for Fallon's comments on the SPX and COMP charts, as well.
It's the top of the month and a good time to check some of the latest stats.
Ironman has the latest information on Median Household Income In September 2021. With all the current noise around inflation Ironman reports that the rise in median income was greater than the rise in inflation. Positive reporting, indeed.
"Political Calculations' initial estimate of median household income in September 2021 is $70,824, an increase of $519 (or 0.7%) from the initial estimate of $70,305 for August 2021.
The latest update to Political Calculations' chart tracking Median Household Income in the 21st Century shows the nominal (red) and inflation-adjusted (blue) trends for median household income in the United States from January 2000 through September 2021. The inflation-adjusted figures are presented in terms of constant September 2021 U.S. dollars."
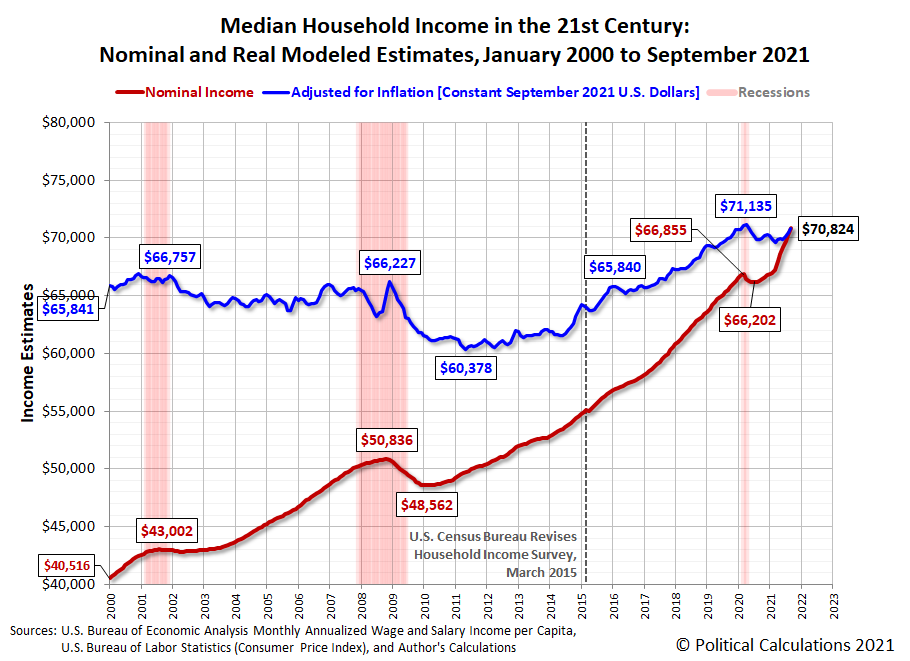
"September 2021 saw inflation once again rise more slowly than median household income, with the typical income-earning American household gaining a little more purchasing power during the month. Adjusted for inflation, median household income remains below the April 2020 peak of $71,135 in terms of constant September 2021 U.S. dollars. That change can be considered good news because 2021 has generally seen inflation rise faster than median household income."
Ironman's October Median Household Income report will be out December 1.
TM contributor New Deal Democrat notes Manufacturing Remained Strong In October, While Construction Spending Declined In September.
"...the ISM report ...is an important short-leading indicator for the production sector. Here the total index declined slightly - mere -03 - to 60.8, and the more leading new orders subindex declined sharply - by -6.9 to 59.8"
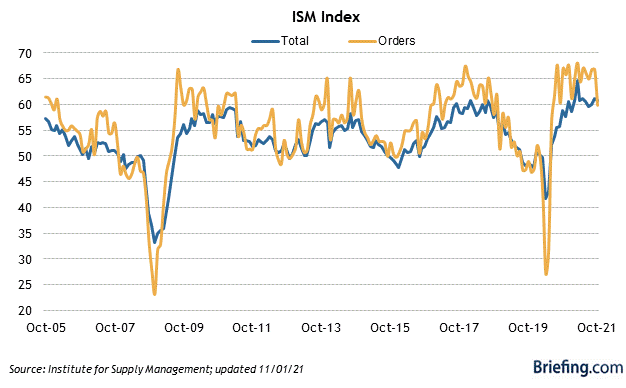
"Since the break-even point between increasing and decreasing numbers of respondents, both of October’s numbers in fact show strong expansion - in the case of new orders, simply not nearly so strong as in most of the last 12 months. In short, still quite positive."
New Deal Democrat notes that the pace of construction activity in the U.S. is continuing to decline, though not to recessionary levels.
"Adjusting for price changes in construction materials, which jumped by 0.7% in September, “real” construction spending declined -1.3%m/m, and “real” residential construction spending declined -1.1%. In absolute terms, “real” construction spending has declined sharply earlier this year, although there has been relative stabilization in the last few months:
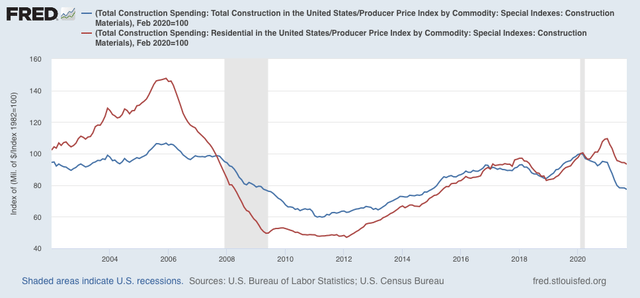
“Real” total construction spending has now declined -18.7% since its post-recession peak in November 2020, while “real” residential construction spending has declined -14.8% since its post-recession peak in January of this year."
Contributor Jill Mislinski has the latest set of world-wide stock market measures in her World Markets Update: Monday, Nov. 1. I have excerpted one of the charts below. See the full article for additional perspectives.
"Seven out of eight indexes on our world watch list posted gains through November 1, 2021. The top performer is India's BSE SENSEX with a gain of 25.94%, France's CAC 40 is in second is with a gain of 24.17%, and our own S&P 500 is in third with a gain of 22.83%. Coming in last is Hong Kong's Hang Seng with a loss of 7.63%."


Turning to subjects of personal finance, Marc Lichtenfeld suggests What You Can Do To Protect Yourself Against Inflation Today.

"Inflation is like a parasite. You don’t realize you have it until one day you wake up sick – except, in this case, it’s your wealth that suffers...
Steps to take with your cash are very different from what to do with your longer-term holdings.
Below are a few things you can do to protect assets from inflation.
Long-Term Funds
For your long-term funds, I strongly recommend investing in Perpetual Dividend Raisers. These are stocks that raise their dividends every year. This way, you’re growing your income, and if the dividends are boosted at a higher rate than that of inflation, you’re actually increasing your buying power.
Look for companies that have a track record of annual dividend hikes that continually rise by a meaningful amount. Raising the dividend by 1% per year won’t help much.
A company like Enbridge ( ENB) has raised its dividend every year for 26 years. Over the past 10 years, the compound annual growth rate of the dividend is 10.9%. That should keep investors well ahead of inflation.
Intermediate Term
Readers of my newsletter, The Oxford Income Letter, were told about Series I bonds months ago. I bonds are U.S. government bonds whose interest rates reset every six months according to inflation.
The November I bond rate will be announced today. It is expected to be around 7% annualized.
You can’t cash out of the bond within the first 12 months after your purchase. If you sell before five years pass, you lose three months’ worth of interest.
But these bonds will keep pace with inflation, protecting your funds.
The maximum you can buy is $10,000 per person per year, plus another $5,000 if it is purchased with a tax refund.
This is a great way to hedge against inflation without risk, as long as you don’t need the cash within one year.
Short Term
This one is tougher. You won’t get adequate inflation protection with a short-term investment. Interest rates on money market accounts and certificates of deposit (CDs) are just too low. While interest rates on Treasurys have inched higher, rates for savers have barely budged.
In regard to your short-term cash that you need access to within a year or so, you won’t be able to earn 5%-plus on it without taking on some risk.
You can search online for the best money market or CD rates.
I wish there were a better answer, but there simply isn’t unless you take on risk, which is precisely what you don’t want to do if you need the cash in the near term.
I expect inflation to continue higher this year and into 2022. I believe the most important financial step you can take these days is to ensure that your buying power isn’t destroyed over the coming years."
In the risk taking department Sweta Killa catalogs 6 Leveraged ETFs That Gained More Than 25% In October.
"October was the best month of this year for Wall Street. All the three main indices soared on earnings optimism. The S&P 500 and the Nasdaq Composite Index notched their best months since November 2020, gaining around 7% each. The Dow Jones surged nearly 6% in October, its best monthly gain since March."

Image: Bigstock
" ...(There is) huge demand for leveraged ETFs as investors seek to register big gains in a short span. Leveraged funds provide multiple exposure (2X or 3X) to the daily performance of the underlying index by employing various investment strategies such as swaps, futures contracts and other derivative instruments. Due to their compounding effect, investors can enjoy higher returns in a very short period of time, provided the trend remains positive.
Below we highlight some best-performing leveraged equity ETFs from different corners of the market that gained more than 25% in October. These funds will continue to be investors’ darlings, provided the sentiments remain bullish.
Direxion Daily Transportation Bull 3X Shares (TPOR) – Up 37.5%
TPOR targets the transportation sector and seeks to deliver three times the daily performance of the Dow Jones Transportation Average Index. The product has AUM of $86.8 million and charges 95 bps in fees and expenses. It trades in lower volumes of about 119,000 shares per day.
Direxion Daily Consumer Discretionary Bull 3X Shares (WANT) – Up 36.1%
This ETF seeks to offer three times exposure to the Consumer Discretionary Select Sector Index, charging 95 bps in annual fees. It has AUM of $52.8 million and an average daily volume of 23,000 shares.
Direxion Daily Global Clean Energy Bull 2X Shares (KLNE) – Up 33.3%
This fund provides two times exposure to the performance of the S&P Global Clean Energy Index, charging investors’ 95 bps in annual fees. It has accumulated $7.1 million in its asset base since its inception in late July and trades in a paltry average daily volume of 3,000 shares.
BMO REX MicroSectors FANG+ Index 3X Leveraged ETN (FNGU) – Up 31.3%
This note seeks to offer three times leveraged exposure to the NYSE FANG Index, charging 95 bps in annual fees. The ETN has accumulated $2.2 billion in its asset base and trades in an average daily volume of 2.3 million shares.
Direxion Daily Junior Gold Miners Index Bull 2x Shares (JNUG) – Up 26.6%
This product provides two times exposure to the daily performance of the MVIS Global Junior Gold Miners Index. It charges 87 bps in annual fees and has accumulated $559.8 million in its asset base. Volume is heavy, exchanging about 1.2 in shares per day on average.
Direxion Daily Homebuilders & Supplies Bull 3X Shares (NAIL) - Up 25.9%
NAIL provides leveraged exposure to homebuilders and creates a three-times-long position in the Dow Jones U.S. Select Home Construction Index. It charges an annual fee of 95 bps and trades in a good average daily volume of about 1.2 million shares. The fund has amassed $379 million in its asset base.
Bottom Line
While this strategy is highly beneficial for short-term traders, it could lead to huge losses compared to the traditional funds in fluctuating or seesawing markets. Further, the funds’ performance could vary significantly from the actual performance of their underlying index over a longer period when compared to the shorter period (such as weeks or months) due to their compounding effect."
For the day traders out there I'll close the column out with contributor Christopher Lewis' latest take on the Nasdaq, Nasdaq 100 Forecast: Primed To Continue Bullish Move.
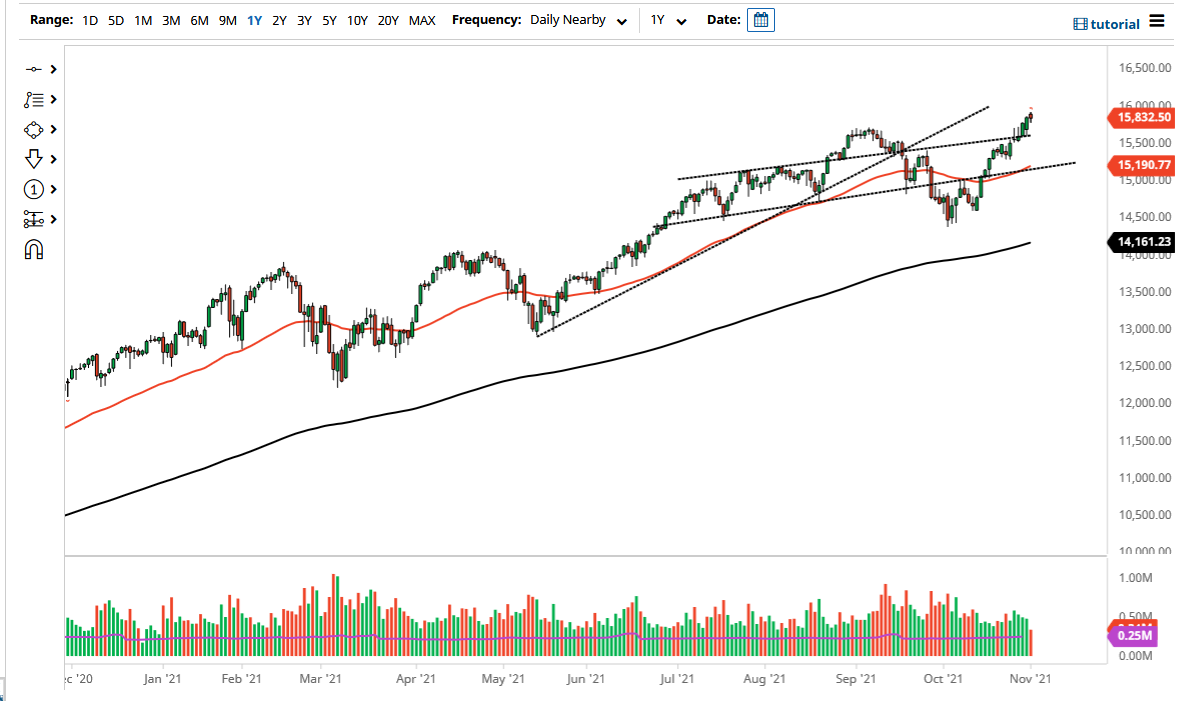
"...At this point, the market looks as if it is ready to continue grinding away to the upside, with the 16,000 level being the next big figure that people are paying close attention to. The 16,000 level has a certain amount of psychology attached to it, but at the end of the day it is just that, a psychology-related number. In other words, there is no real reason to think that this market will fall apart...I think we will go higher over the next several weeks, but we are a little extended and we may have to consolidate back and forth in order to digest some of the recent gains..."
As always, Caveat Emptor.
With the climate summit underway in Glasgow I leave you with this quote from American author and environmentalist, Aldo Leopold:
“The wind that makes music in November corn is in a hurry. The stalks hum, the loose husks whisk skyward in half-playing swirls, and the wind hurries on… A tree tries to argue, bare limbs waving, but there is no detaining the wind”
Today is Election Day. Don't forget to vote. I'll be back on Thursday.


The advice to those with savings and investments is good, but not applicable for those who need to invest their "savings" in groceries to eat the next week. Those folks who are unable to easily increase their incomes are the ones who suffer from the dollar degredation the most. They are not part of that "1%, nor even part ofthe top 20% of the population, but they are a whole lot of folksin that realm.
So certainly while it looks good for a fair number of investers, which is fine, it is not good for all of them. Consider that there is a s much below that median as there is above it.
That is sadly, still very true, as are the large numbers of "middle class" households just two or three paychecks away from homelessness.
And if not as extreme as being homeless, certainly being in a situation where some things are just no longer affordable. Painful and unhappy times, but not all the way to homeless.
That is sadly, still very true, as are the large numbers of "middle class" households just two or three paychecks away from homelessness.