
Tuesday Talk: Dizzy, Much?
No one can fault you for feeling dizzy, lately. The frenetic pace of the market merry-go-round has left more than a few heads spinning. All three market indices closed down, hitting the ground hard, on Monday.

Yesterday, the S&P 500 closed at 4,568, down 53 points or 1.14%, the Dow closed at 34,932, down 433 points or 1.23%, and the Nasdaq Composite closed at 14,981, down 188 points or 1.24%. Market futures are currently green, S&P futures are trading up 44 points, Dow futures are trading up 321 points and Nasdaq 100 futures are trading up 175 points.
While much of Monday's sell-off was attributed to resurgent Omicron fears, paradoxically four out of the eight top gainers yesterday, were travel related issues.

Chart: The New York Times
Assessing some of the damage is TM contributor Mike Swanson who notes that There Has Been More Selling Than Buying In The Stock Market For Weeks.
"There has been more selling than buying in the stock market for weeks and now it is starting to hurt the S&P 500. Now the selling has hurt the Russell 2000 (IWM) and things such as the ARKK ETF for months and the type of stocks inside of it, but now that damage is spreading...buying volume peaked in November, but the S&P 500 managed to make a new high last week. What that was is a negative divergence in the markets. This indicator is still above its November and September lows, but if it goes below those lows then you should take this as a SECOND flashing red warning sign on the markets."

"Let’s see what happens, but it is really hard for the market to go up for more than a day or two when this indicator is in a downtrend like this. And there are other things I’m watching too – like will bonds go up or down the rest of this year if the market continue to act like this?"
Contributor J. Brumley says Monday's Meltdown Makes Tuesday A Critical Day.
"Fears of more trouble from Omicron ended up getting the better of investors on Monday, despite Friday's late rebound effort...We've survived worse, of course...In question is the Nasdaq Composite...the Nasdaq was barely holding above the lower boundary of trading range that's been in place since March; another support line has also materialized since early this month. These lines are orange and red (dashed), respectively, on the chart below. As you can see, the lower, longer-term floor was brushed with today's low, and even with the intraday recovery the upper, shorter-term floor wasn't reclaimed. Rather, the composite closed just under it."
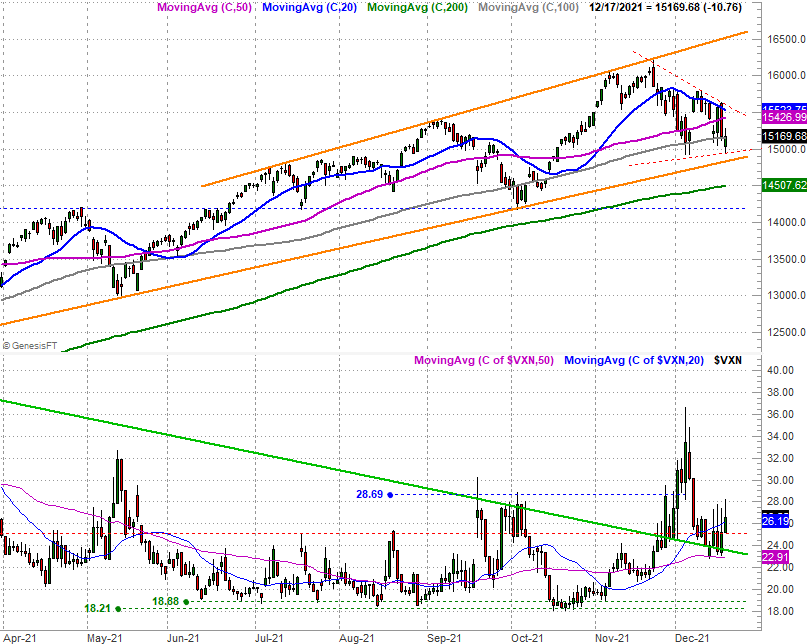
"None of it means anything yet. The lower boundary of the trading range -- currently at 14,845 -- would need to be broken before entertaining any ideas of a serious correction. And, just for good measure, the 200-day moving average line (green) currently at 14,518 would also need to be broken before assuming the worst."
Bromley, also weighs in on the VIX and the S&P 500 (SPX) before concluding thusly:
"this all makes Tuesday a big day, we can't necessarily conclude a gain tomorrow is the same thing as an "all clear." Breaking floors and ceilings is often more of a process than an event...Another really bad day straightaway would actually invite a good deal of dip-buying."
For a video view of yesterday's action with an accent on the positive, you can watch contributor Brandon Chapman's under twenty minute commentary entitled Bulls Find Silver Lining Into The Close. Chapman's set-up for Tuesday is this:
"The S&P 500 rallied and the VIX fell into the close as the market found intraday support. While it isn't exactly a ringing endorsement that the market is heading higher, it is an indication that the Grinch hasn't entirely spoiled the fun. Looking at breadth, there was an early indication and bullish unusual option activity in financials provides another silver lining."
Cullen Roche has 3 things on his mind in his article, Three Things I Think I Think – Bye Bye Bye BBB. Roche is thinking about the fate of President Biden's "Build Back Better" initiative, Cathie Wood's Ark Innovation Fund, and Modern Monetary Theory. Go to Roche's article for topics 1 and 3. Below is what he has to say about ARKK:
"I really like Cathie Wood. I think her ETFs are thoughtful and interesting. I’m obviously not a big advocate of stock picking and higher fee active management, but whatever. Her funds have done great. You can’t knock them. Unfortunately, the money-weighted returns have been dreadful because, just like picking stocks, picking the best manager is hard. And people tend to chase performance. So, here we have a case where investors piled into ARKK after it did really well. Unsurprisingly, people who chase returns are usually just chasing risk. And so they were piling into what had actually become a riskier vehicle after its underlying securities had generated their huge returns. And now the fund is down 22% this year."
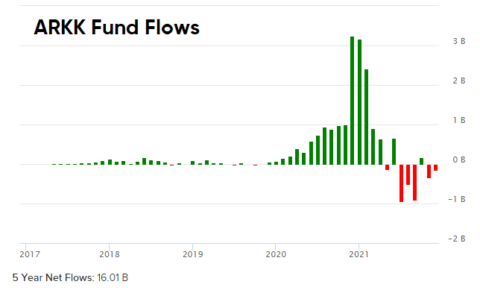
"This isn’t a knock on Cathie. She can’t control the fund flows. It’s just an observation about investor psychology and how we tend to see the same trends play out time and time again. Investors always think the grass is greener somewhere else and constantly chase returns. It’s why I’ve become such a big advocate of Discipline Based Investing over the years. The adequate strategy that you stay disciplined to will likely generate better returns than trying to constantly chase the perfect strategy."
In today's Where To Invest department, TM contributor Tyler Bundy asks How Does Nike's Stock Look Coming Out Of Earnings?.

Image: Benzinga
"Nike was down 2.62% at $157.13 at market close (on Monday). After the closing bell, the company (NKE) reported earnings. Nike reported quarterly earnings of 83 cents per share, which beat the analyst consensus estimate of 63 cents by 31.75%. The company reported quarterly sales of $11.36 billion, which beat the analyst consensus estimate of $11.25 billion. Shares were up about 3.6% to $162 71 in after-hours trading...Nike's stock is forming into the ascending triangle pattern and could be due for a breakout and a strong bullish move if the stock can cross above the $175 level. Bulls want to see the stock hold above the higher low trendline and go on to cross above the $175 level. Bears want to see the stock fall below this higher low trendline and for the stock to make a strong bearish move. A cross below the trendline may hint the stock is ready to start forming into a downward trend."
See Bundy's article for the chart and additional details. Caveat Emptor.
TalkMarkets contributor Anshool Deshmukh closes out today's column with a set of maps in a blockbuster piece entitled, Mapped: Economic Freedom Around The World. Deshmukh provides a worldview (displayed below) map, as well as individual maps by region.
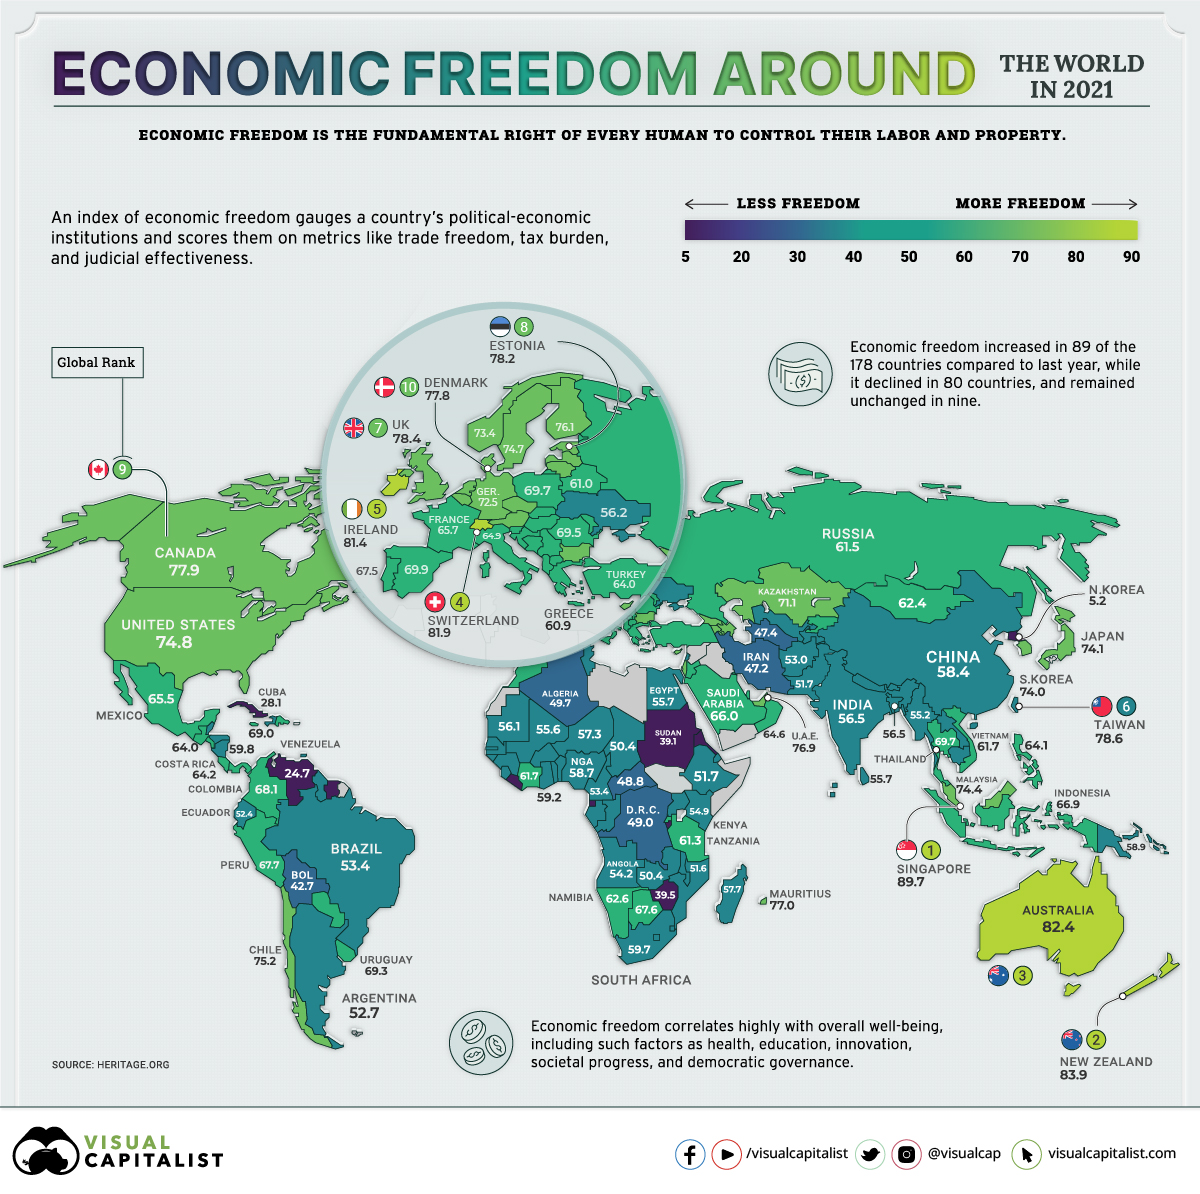
"The cornerstones of economic freedom by most measures are personal choice, voluntary exchange, independence to compete in markets, and security of the person and privately-owned property. Simply put, it is about the quality of political and economic institutions in countries.
Based on the Index of Economic Freedom by the Heritage Organization, we mapped the economic freedom of 178 countries worldwide.
Measures of Economic Freedom
The index uses five broad areas to score economic freedom for each country:
- Size of Government: Greater government spending, taxation, and bigger government agencies tend to reduce individual choice and economic freedom.
- Legal System and Property Rights: The ability to accumulate private property and wealth is a central motivating force for workers and investors in a market economy, and well-functioning legal frameworks protect the rights of all citizens.
- Sound Money: Does earned money maintain its value, or is it lost to inflation? When inflation is high and volatile, individuals can’t plan for the future and use economic freedom effectively.
- Freedom to Trade Internationally: Freedom to exchange—in its broadest sense, buying, selling, making contracts, and so on—is considered essential to economic prosperity. Limited international trading options significantly reduce the potential for growth.
- Regulation: When governments utilize tools and impose oppressive regulations that limit the right to exchange, economic freedom typically suffers.
In 2021, the global average economic freedom score is 61.6, the highest its been in 27 years."
Do read Deshmukh's complete article for the full take on global economic freedom by region. It is cogent and current, and helpful reading as we head into 2022.
I'll see you on Thursday.


