
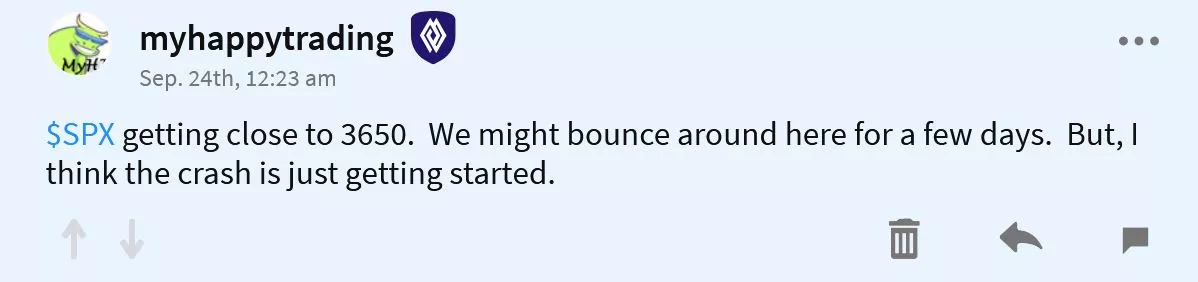
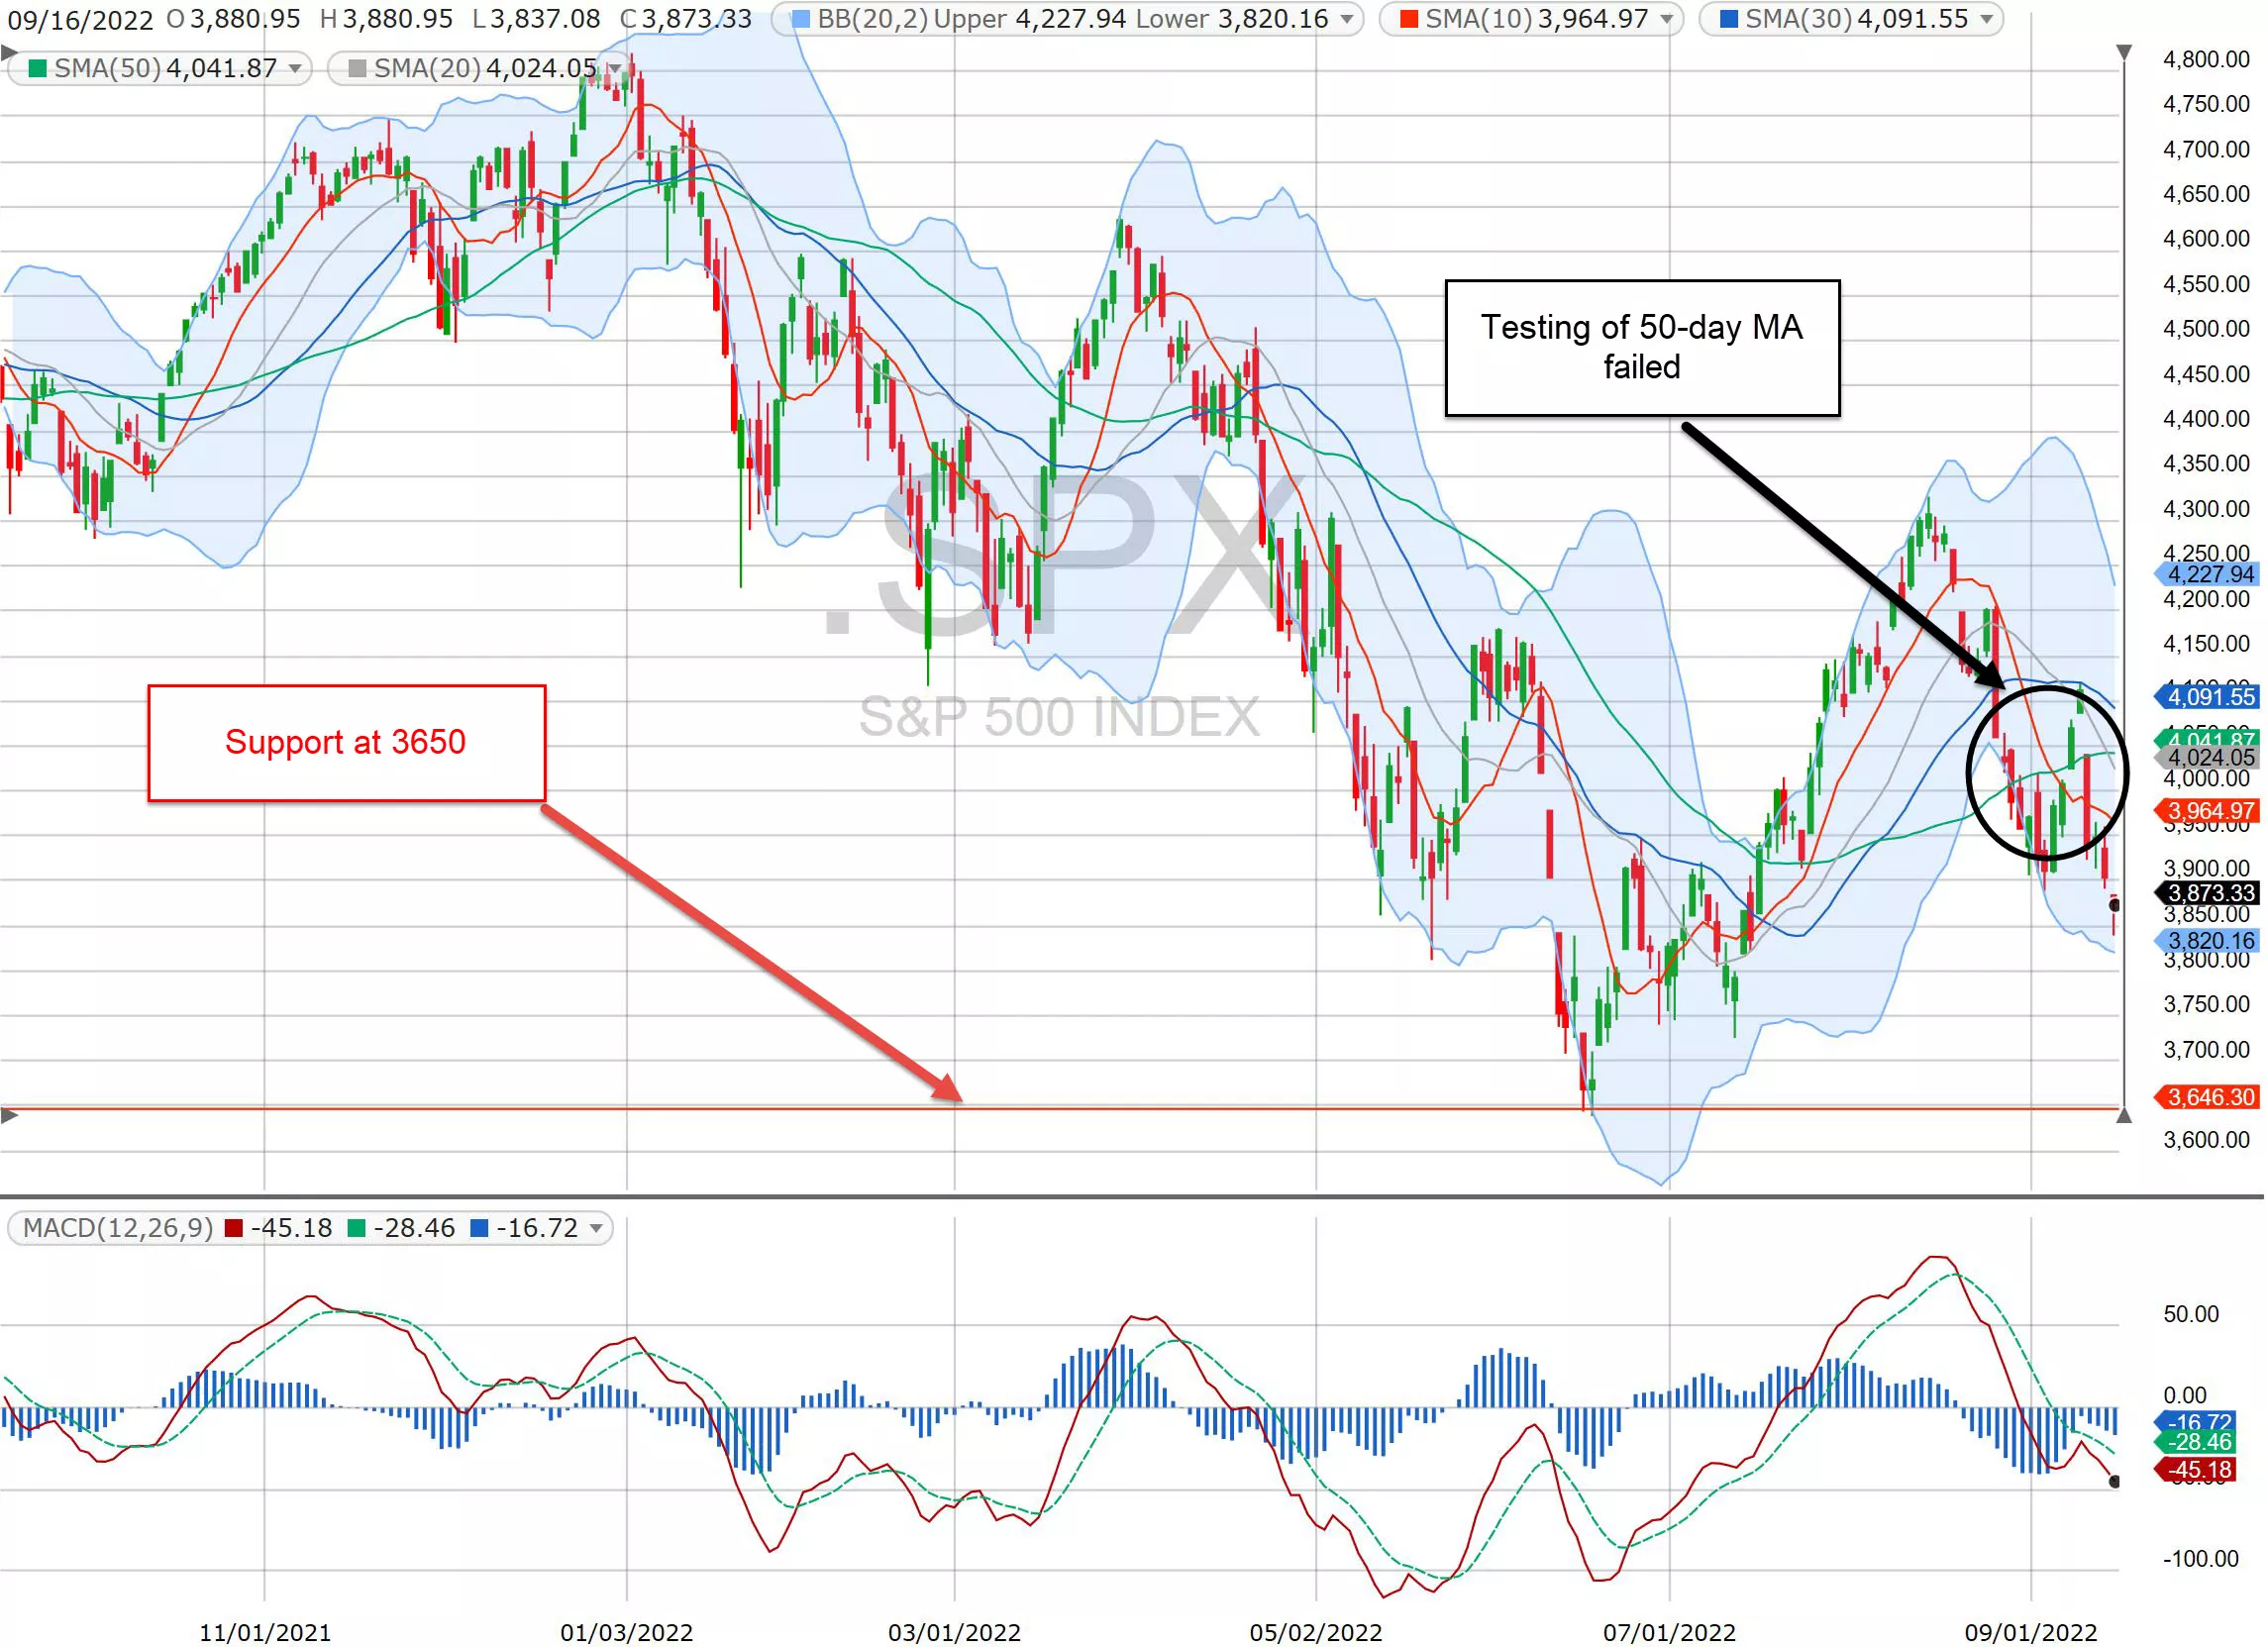
In my last article, "Sell Oil. Buy Solar?", I said, " SPX is now slip-and-sliding downwards towards the low set back in June, which is at around 3650." On Friday, SPX touched below 3650 but bounced a bit to close 3693.23. I also said oil needs to come down, and on Friday, oil stocks mostly tumbled. I specifically pointed out XOM, which dropped more than 5%. Near-the-money put options of these oil stocks mostly more than doubled! Last checked, oil prices are still high, near $90/barrel. I believe the prices of oil will continue to drop. If Russia needs to draft citizens and send them to the front line in Ukraine to fight a senseless war, Russia is in big trouble. This war on Ukraine may end before year 2022 does.

In my previous article, I also expressed that I think the financial environment has been pushed out-of-wack due to the 2008 financial crisis. Now, "maybe we just need to return to the norm". On Friday, even Barron's published an article confirming the same thought that "we are heading for normal". Also, in an environment such as the one that the stocks are in right now, gold and silver should be rising, not dropping.
Not only are gold and silver are not functioning in a "normal" fashion, SDS (ultra short SPX ETF) and UVXY (proshares ultra VIX ETF) have not behaving as they should either. In a long bullish stock environment, many fund managers and investors got used to shorting SDS and UVXY, so much so that they sell naked calls on trading vehicles such as SDS and UVXY. We will use a chart on SDS to demonstrate the "ab"-nomalcy in the behavior of these ETFs:
SDS
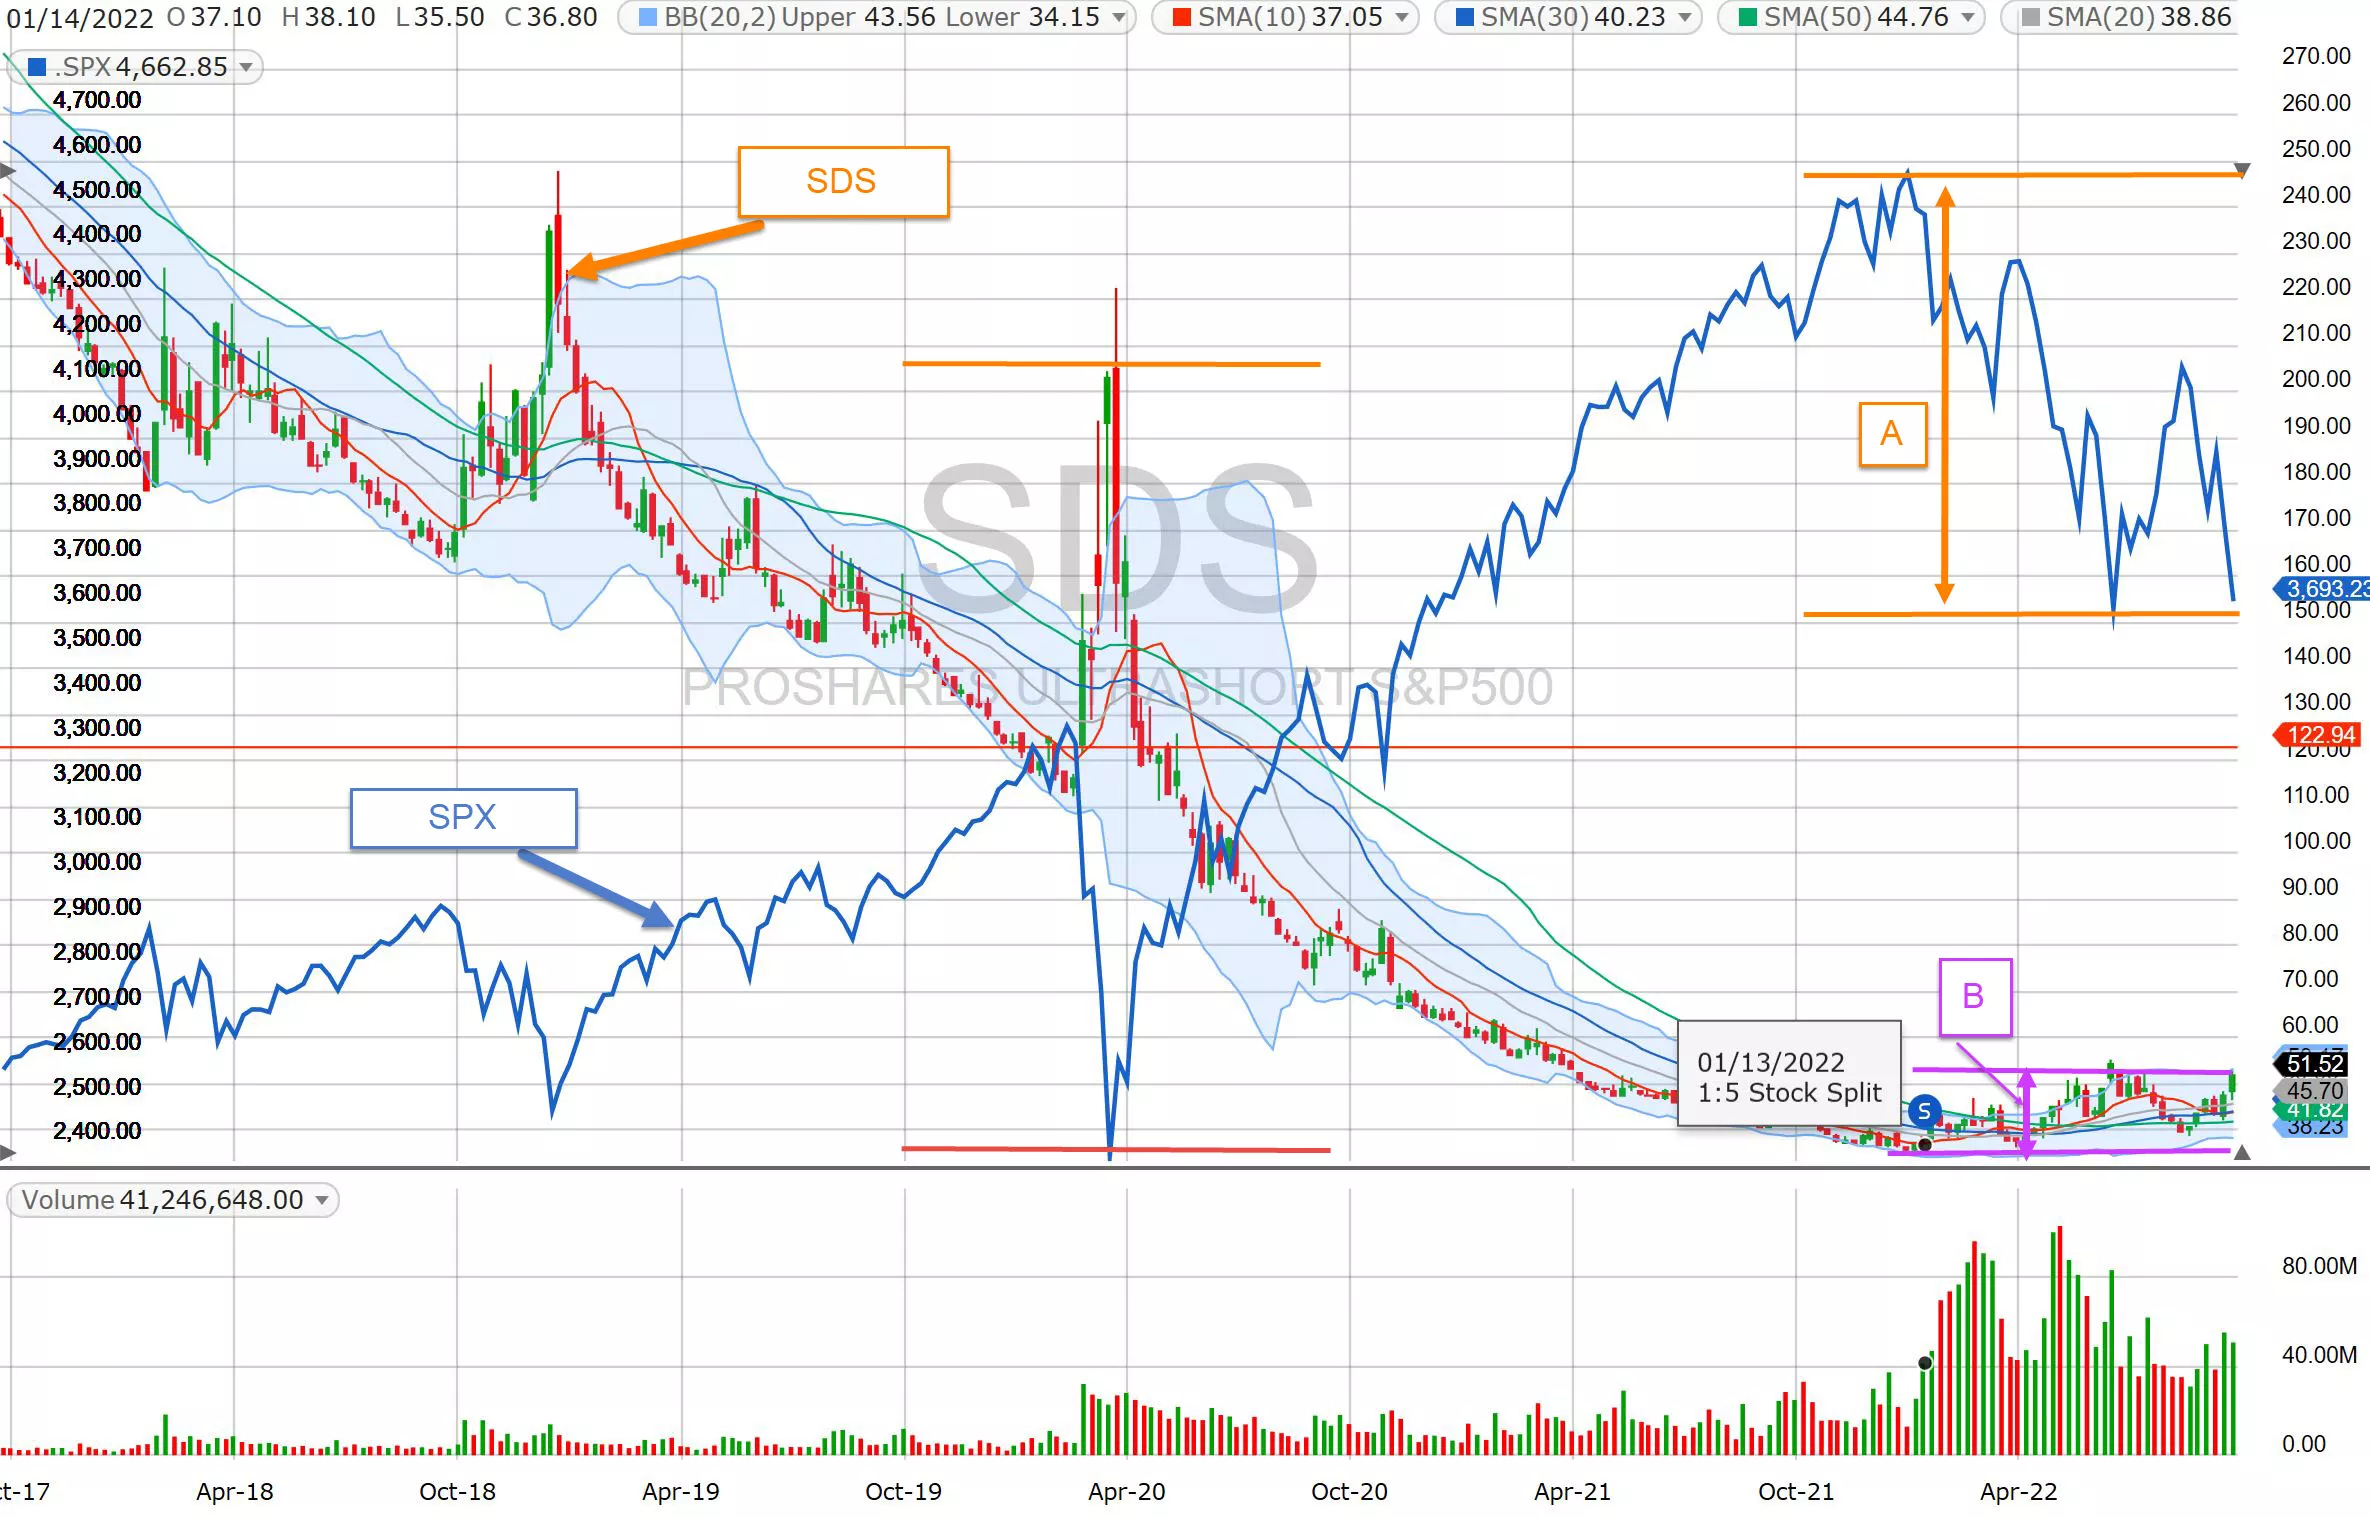
In the above SDS weekly chart, we can see that back in early 2020, when the COVID pandemic erupted, the stock market fell dramatically. SPX tumbled more than 1000 points. On a dual-axis chart, we can see that the amount that SDS rose is comparable to the amount that SPX fell; the lines for SDS and SPX produced a "mirror" image. However, since early 2022, SPX has also fallen more than 1000 points, but, SDS has barely risen. On of the factors is perhaps that SDS had a 1:5 split. But, the disparity between the SPX and SDS movements is too great. In the chart above, one can easily see that Distance A (amount which SPX has fallen) is much greater than Distance B (amount which SDS has risen). If the rise of SDS gains momentum, I believe we could see SDS double or triple from here in the near-term. UVXY shows the similar disparity, and the multiples to which it can rise may be much more than that of SDS.
On Friday, I posted on Stocktwits:
Good morning and HappyTrading! ™
More By This Author:
Sell Oil. Buy Solar?
Stocks Coming Back Down
Still No Global Warming?


Comments
Log in or sign up to join the conversation.