
Thoughts For Thursday: When The CPI Hits Your Eye Like A Big Pizza Pie, What's That?
The big question moving into the end of the week is how markets will react to Friday's BLS release of May's CPI data. So far risk-off sentiment seems to be carrying the day.

Yesterday the S&P closed at 4,116, down 45 points, the Dow closed at 32,911, down 269 points, and the Nasdaq Composite closed at 12,086, down 89 points.
Wednesday's most actives were all large caps and all closed in the red.

Chart: The New York Times
Market futures have just bolted green after having started out red in the wee hours. S&P 500 market futures are trading up 20 points, Dow market futures are up 143 points, and Nasdaq 100 market futures are up 69 points.
TalkMarkets contributor Michael Kramer notes that Stocks Drop On June 8, And Further Declines May Be Coming.
S&P 500
"Stocks finished the day lower, with the S&P 500 (SPX) dropping by 1.1%. We appear to be in a distribution pattern right now, churning at the top of the range. Today, we closed right above the lower uptrend, which helps form the diamond pattern in the S&P 500. Again, as I have noted for a few days, I think we see 3980 based on this pattern. Typically, these are reversal patterns, and they tend to return to the origin of the move higher. Which is lower than 3,980, but I am using that level because I believe there should be support there."

Nasdaq
"The pattern on the QQQ is a diamond too, but only the top half. The red line is the mid-point and support, currently around $307. For now, I think the QQQ can fall back to $300, maybe a bit lower, for the same reason as the S&P 500 dropping."

Kramer also looks at the charts for AMD, ROKU and Adobe (ADBE), he isn't cheering the upside, yet.
The New York Times reported that "8 in 10 Americans consider the national economy to be in poor condition". That's a pretty daunting statistic and frankly, I don't get it. We've got record employment at a time when the world is coping with recovering from a devastating pandemic, Russia continues its brutal onslaught on Ukraine, and Congress can't pass gun control legislation. For those who didn't pay attention in history class here is a picture of what a national economy in poor condition looks like:

Contributor Cullen Roche has some thoughts on the subject also, including a short 3 minute video discussing why the US is not bankrupt: Government Bankruptcy, Misery & The Return Of The 70s.
I leave it to you to click thru to his economics lesson video, but below are his thoughts on where things stand at the moment.
"Are we already in a recession?
There was an interesting poll going around showing that many people already believe we’re in a recession. We’re obviously not in a technical recession, but my theory for this poll, aside from political bias, is that a lot of people actually feel like this is a recession because of inflation. The basic thinking is that high inflation, even with low unemployment, has such a disproportionate impact that people still feel worse.
The best way to visualize this is the so-called “misery index” which calculates the unemployment rate and the inflation rate into one index thereby quantifying how much “misery” we feel in the economy at times.
If we look at current readings we can see that we’re at levels that are largely consistent with recessionary environments like 2020, 2009, 1991 and the late 1970s. When inflation is high it doesn’t even matter if you have a job because you still feel like you’re going backwards in many ways.

Are we Returning to the 70s?
Speaking of the 1970s – I mentioned on Twitter that I don’t think inflation has ever been harder to predict. For instance, compare the moreflation vs lessflation arguments:
Moreflation:
– Ukraine War
– China shutdown
– Booming commodity prices
Lessflation:
– Fiscal tightening
– Rising rates
– Soft housing
– Inventory restocking
– Rising recession risk
These things could go either way. For instance, let’s assume the war in Ukraine gets worse and worse and oil prices surge to $200. In that case, it’s almost impossible to think that inflation comes down materially. On the other hand, there are tons of recession signals flaring up all over the place that would be consistent with collapsing demand. I’ve been saying this a lot in recent years, but I feel like the range of outcomes here remains SO wide. I like to think I feel confident about making inflation predictions, but not in this environment. There are just too many anomalous things that could push the needle really far in one direction or the other."
Economist and TalkMarkets contributor Menzie Chinn provides a more academic look in Sixty Years Of The “Misery Index”.
"The simple sum of the unemployment rate and the (y/y) inflation rate:
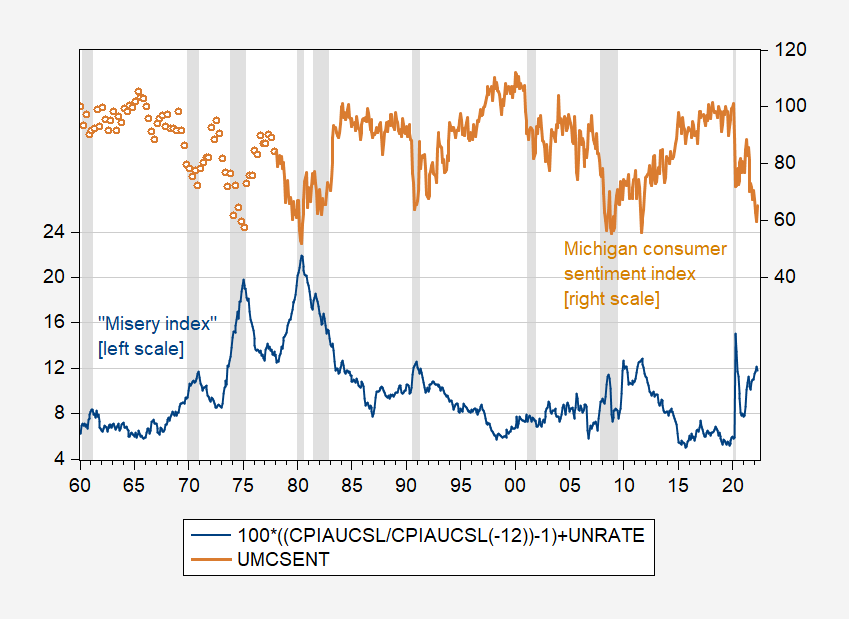
Figure 1: “Misery index” as sum of inflation and unemployment rate, in % (blue, left scale), and University of Michigan Consumer Sentiment index (brown, right scale). May 2022 observation for misery index uses Cleveland Fed nowcast of 6/1. NBER defined recession dates shaded gray. Source: BLS via FRED, Cleveland Fed, U.Mich., NBER, and author’s calculations.
There’s no particular reason to give equal weight to inflation and unemployment; rather Arthur Okun suggested this particular composite (which he called a “discomfort index”) as a way of conveying an idea in a simple way (see Cohen, et al. 2014 for history). Jimmy Carter subsequently cited this measure as an index of “economic misery”.
How is this related to measures of how people actually describe their discomfort? One popular measure of economic satisfaction is the University of Michigan Index of Consumer Sentiment (shown as the brown line in Figure 1). This index is clearly inversely related to the misery index:
UMCSENT = 161.36 – 2.99MISERY – 0.022TIMETREND
Adj-R2 = 0.55, SER = 8.405, DW = 0.23, Nobs = 604. Bold denotes significance at 10% msl, using HAC robust standard errors.
There is no particular reason why one should weight unemployment and inflation equally.
UMCSENT = 161.00 – 2.58INFLATION – 3.86UNRATE – 0.020TIMETREND
Adj-R2 = 0.57, SER = 8.221, DW = 0.25, Nobs = 604. Bold denotes significance at 10% msl, using HAC robust standard errors.
While the INFLATION and UNRATE coefficients do not look particularly different, a Wald test rejects equality at very high levels of significance.
Several interesting aspects to the relationship between the misery index and consumer sentiment.
First, the relationship is not stable; Bai-Perron least squares break point tests indicate three breaks over the graphed period.
Second, relatedly, importance of unemployment and inflation change over time, both in terms of the slope coefficients, and in terms of standardized beta coefficients. In the latest two years, inflation looms larger."
Contributor Jing Ren takes note of USD strength against the Swiss franc and particular note of the high price of oil related to its current scarcity in a short trading related piece entitled Intraday Market Analysis: USD Bounces Back.
US Oil tests resistance
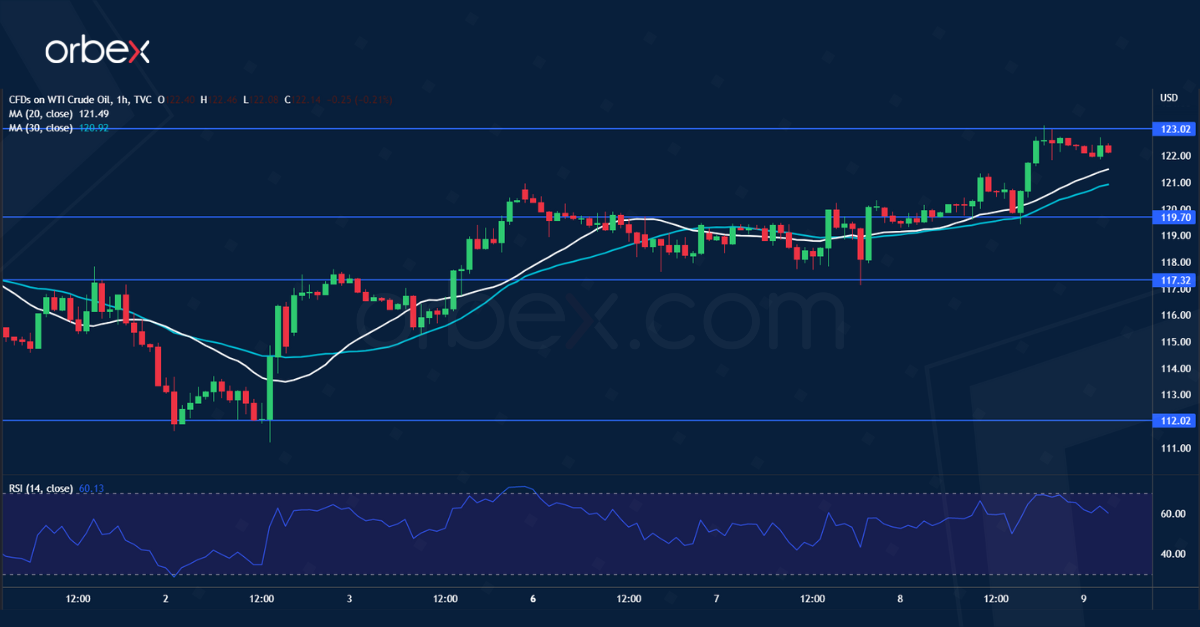
"WTI crude finds support from tight spare capacity. A close above the recent peak at 119.20 has put the price action back on track after a short-lived retracement. The former resistance at 117.30 has turned into support where trend followers are likely to place their bids. A surge above 123.00 would confirm that the path of least resistance is still up and may extend the rally to March’s high at 129.00. On the downside, 119.70 is the immediate support, and 117.30 is the second line of defense for the bulls."
In crypto, TM contributor Christopher Lewis writes that Bitcoin Continues To Go Nowhere.
"Bitcoin (BITCOMP) fell a bit on Wednesday again as we see the $30,000 level act as a bit of a magnet for price. The market certainly looks as if it has nowhere to be, so therefore I think it’s probably going to be a situation where we need to wait for the markets to show signs of life that we can take advantage of."
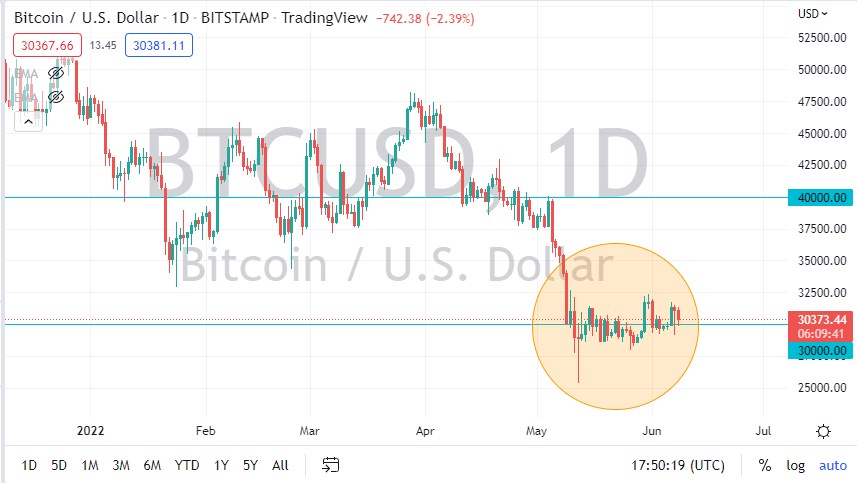
This is an nasty looking chart but far less unpleasant than the reaction it prompts from Lewis:
"If we were to see this market breakdown below the $28,000 level, I think it opens up a significant amount of selling pressure in the Bitcoin market that could send it down to the $25,000 level. The $25,000 level did cause a significant bounce the last time we visited the area, but if we break down below there, and I think we probably would in that scenario, the market is more likely than not going to go down to the $20,000 level.
The $20,000 level opens up for a “crypto winter.” Because of this, if the market order breaks down below there, you would see crypto, in general, do nothing. I think that is the most likely of scenarios, as crypto has been left in the dust. Certainly, there are a lot of altcoins that are going to go to zero. I don’t think that will happen with Bitcoin but the reality is that it leads the rest of the markets, and if we break down below the $20,000 level, the next area would more likely than not go looking to the $12,000 level. This was where we had broken out for the huge move over the last several years, so it would be a complete “round-trip.” As adoption has been miserable, and the US dollar has strengthened, it is the move that makes the most sense."
Oh my, oh my, oh my...
Bottom or not for Big Caps, contributor Derek Lewis suggests you can Invest Like Warren Buffett With These 3 Stocks.
"Buffett has been on a shopping spree throughout 2022, becoming more aggressive on the buy-side than we have seen in recent years.
He’s increased his position in both Apple (AAPL) and General Motors (GM) and has even started a new position within HP (HPQ) . Let’s analyze all three companies a little deeper to understand why he’s made these moves. The chart below illustrates the year-to-date performance of all three companies while blending in the S&P 500 as a benchmark."
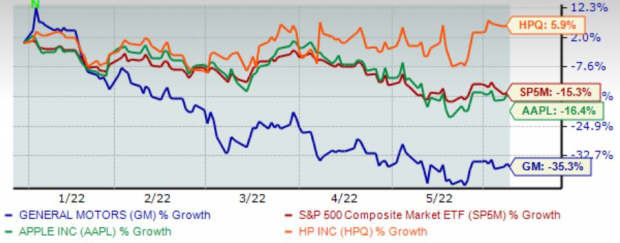
Image Source: Zacks Investment Research
"Apple
Apple has completely shifted the mobile phone landscape over the last decade, and it’s been one of the best places for investors to park their cash. In the previous five years, shares have increased by a stellar 320% and have easily outpaced the S&P 500.
Apple has posted strong quarterly results repeatedly, exceeding EPS estimates in 19 out of its last 20 quarterly reports. Over the previous four quarters, the company has acquired an average EPS surprise in the double-digits of 12%.
Looking at valuation, Apple currently sports a 24.3X forward earnings multiple, well below 2020 highs of 41.5X and modestly above its five-year median of 19.9X. Furthermore, the value represents a 35% premium relative to the S&P 500’s forward P/E ratio of 18.1X.
HP
HP is a leading global provider of personal computing, imaging, and printing products. Over the last five years, shares have increased 158% in value, easily outpacing the S&P 500.
HPQ has consistently reported strong quarterly results, chaining together 13 consecutive EPS beats dating back to 2019. Over its last four quarters, HPQ has acquired an average EPS surprise of 8.4%, and in its latest quarter, the company marginally beat bottom line estimates by 2%.
The current FY22 EPS estimate of $4.31 reflects a sizable 14% growth in earnings year-over-year from 2021. Additionally, earnings are forecasted to grow an additional 2.5% in FY23.
General Motors
Over the last five years, share performance has been a bit disheartening, increasing approximately 25% in value and underperforming the general market by a wide margin.
GM has had robust earnings results, exceeding bottom line estimates in 15 consecutive quarters dating back to 2018. Over its last four quarterly reports, the company sports an average EPS surprise in the double-digits of 25%, and in its latest quarter, GM beat earnings estimates handily by 34%.
General Motors sports a beautifully low 5.6X forward P/E ratio, an absolute fraction of 2020 highs of 22.9X, and nicely below the five-year median of 6.6X. Additionally, the value represents an enormous 69% discount relative to the S&P 500’s value."
Please see Derek Lewis' full article for additional charts and details.
As always, Caveat Emptor.
I'll see you on the other side of the CPI.
Have a good one.


