
Following futures positions of non-commercials are as of May 25, 2021.
10-year note: Currently net long 104.4k, up 72.7k.
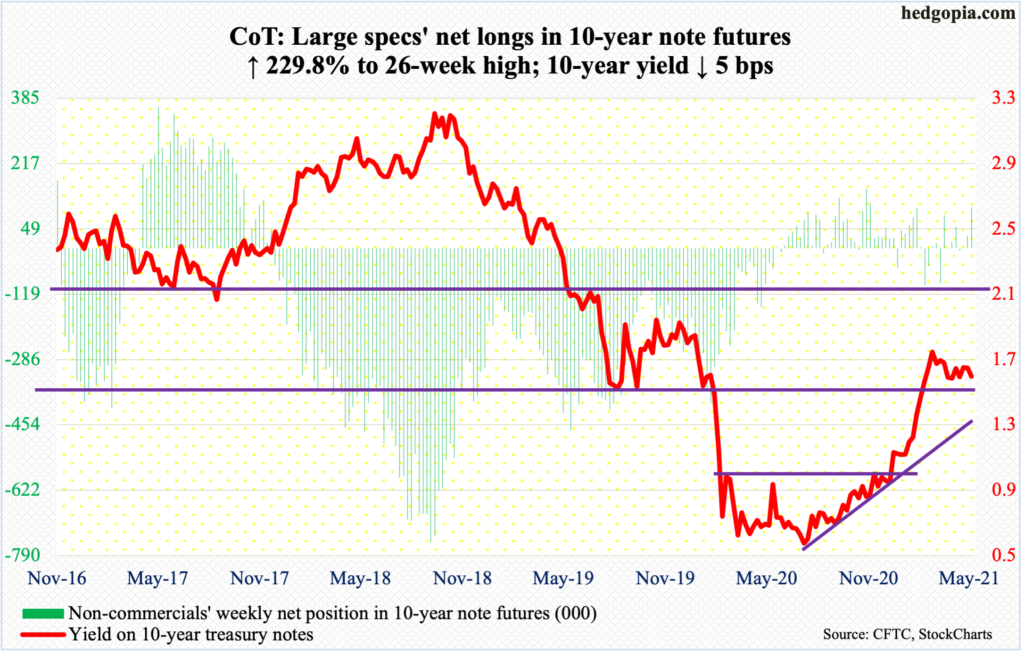
In the week to Wednesday, Federal Reserve assets declined $19.3 billion week-over-week to $7.9 trillion but the prior week’s $7.92 trillion was a new record. On a four-week basis, the buildup is building momentum, with the latest week up $122.6 billion, versus $37.6 billion two weeks ago.
From early March last year, the Fed’s balance sheet is now up $3.66 trillion. The massive accumulation is obviously showing no signs of a let-up. If anything, the Fed seems more committed to purchasing $80 billion in treasury notes and bonds and $40 billion in mortgage-backed securities every month.
This is taking place at a time when a section of the markets – although not a majority – is beginning to worry about inflation. In April, core CPI jumped three percent year-over-year. This was then followed by Friday’s 3.1-percent increase in core PCE, which is the Fed’s favorite measure of consumer inflation. April’s y/y rise in core CPI was the highest since January 1996 and in core PCE the highest since July 1992 (chart here).
The Fed continues to hold the line that this was as expected and that it would prove to be transitory. As things stand, risk of runaway inflation – the kind that was witnessed in the ’70s – is low. This gives the Fed cover for their single-handed focus on jobs and not on inflation. The problem is the pace of the buildup of the balance sheet, unwinding of which is bound to reverberate through all kinds of assets.
The question is, when would the markets begin to seriously worry about tapering? Is it inflation at 3.5 percent, four percent or higher? Or, for that matter, should inflation persist at that rate for three months, six months or longer, before ringing an alarm bell?
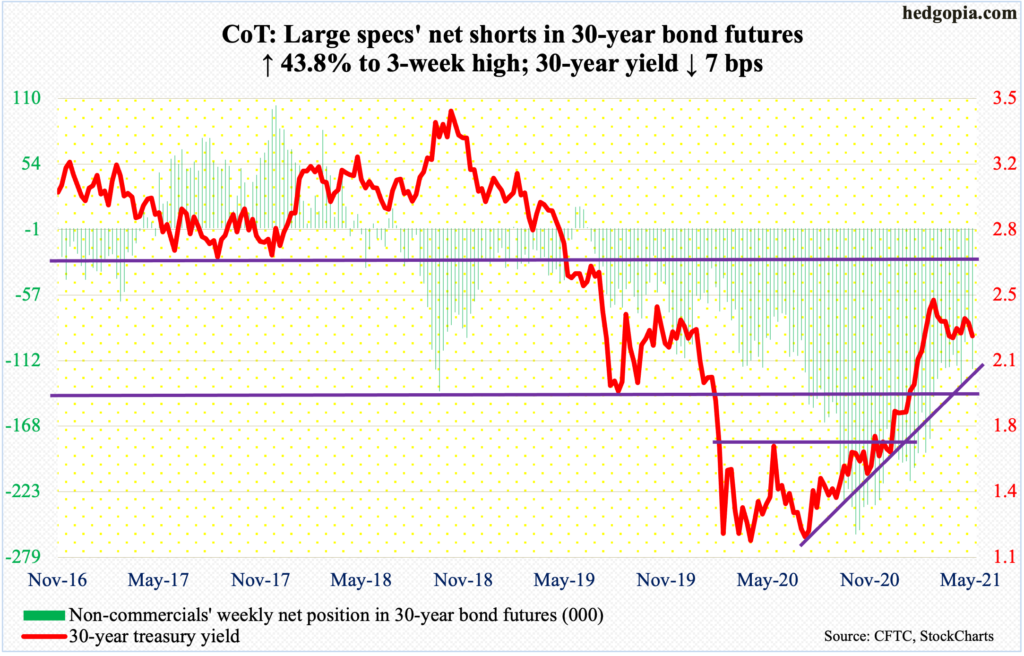
30-year bond: Currently net short 119.4k, up 36.4k.
Major economic releases for next week are as follows. Markets are closed Monday for observance of Memorial Day.
The ISM manufacturing index (May) is due out on Tuesday. Manufacturing activity in April declined four percentage points month-over-month to 60.7 percent.
Labor productivity (1Q21, revised) and the ISM services index (May) will be published on Wednesday.
Preliminarily, non-farm output per hour increased 4.1 percent y/y last quarter – an 11-year high.
Services activity fell one percentage point m/m in April to 62.7 percent.
Friday brings the employment report (May) and durable goods (April, revised).
In March, non-farm payroll grew by a subdued 266,000, for a monthly average this year of 451,000. From the low of April last year, the economy has created 14.1 million jobs to 144.3 million, but this is still 8.2 million less than the pre-pandemic record high of 152.5 million reached in February last year.
Preliminarily in April, orders for non-defense capital goods ex-aircraft – proxy for business capex plans – surged 25.3 percent y/y to a seasonally adjusted annual rate of record $75 billion. Last April, orders hit a post-pandemic low of $59.9 billion.
WTI crude oil: Currently net long 515.1k, up 868.
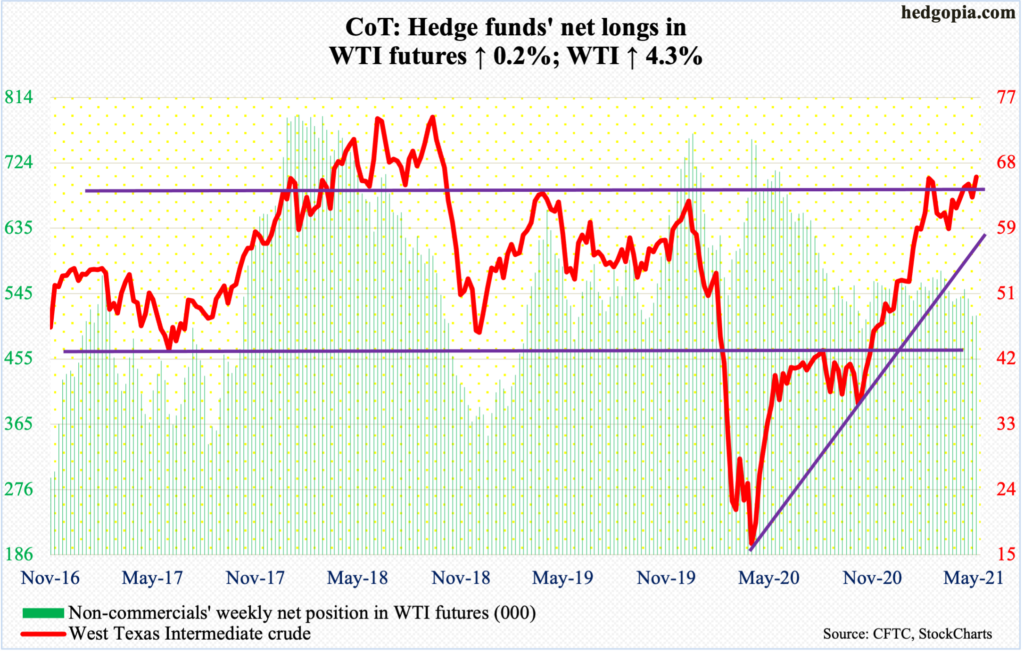
For the third consecutive week, WTI ($66.32/barrel) faced resistance at $66-$67. Last week, after rejection at that ceiling early on, the crude dropped below the 50-day moving average on Friday to tag $61.56 but only to reverse higher by close. This week, it rallied in the first four of the five sessions, but the roadblock would not give way. This price point has attracted sellers for over three weeks now. The daily upper Bollinger band, which is flattish, lies right there as well and was tagged on Friday; the lower band lines up with the 50-day ($62.84).
WTI has essentially gone sideways for nearly three months now. A $66-$67 breakout will be huge, should one occur. Immediately ahead, the daily is beginning to look extended.
In the week to May 21, US crude production was unchanged at 11 million barrels per day. Crude imports fell 138,000 b/d to 6.3 mb/d. Stocks of crude, gasoline and distillates all dropped – respectively down 1.7 million barrels, 1.7 million barrels and three million barrels to 484.3 million barrels, 232.5 million barrels and 129.1 million barrels. Refinery utilization inched up seven-tenths of a percentage point to 87 percent.
E-mini S&P 500: Currently net short 18.5k, down 4.7k.
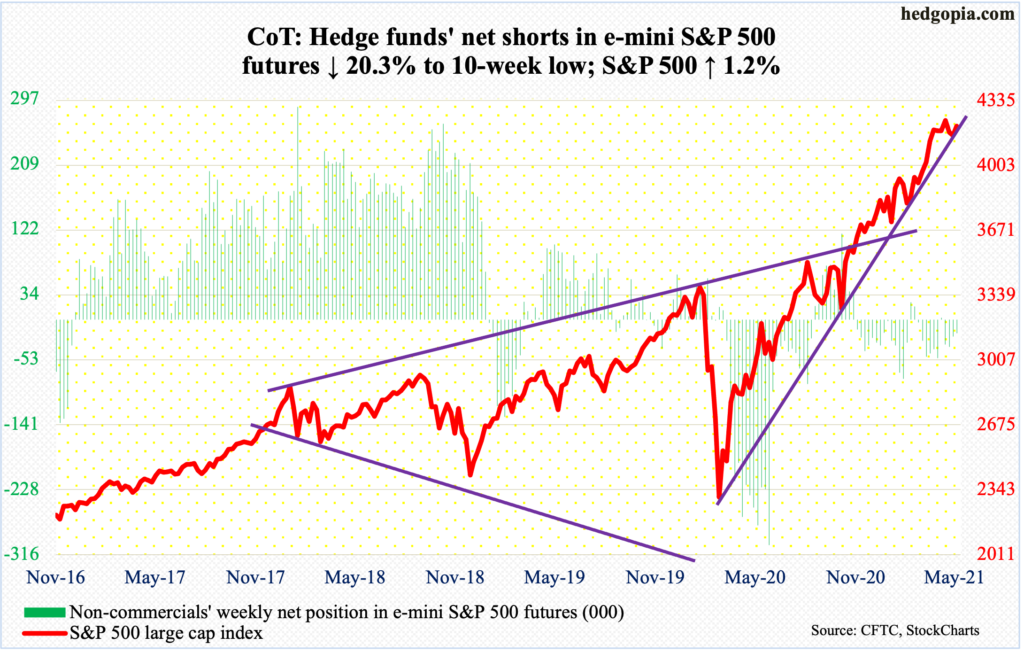
After defense last Wednesday of the 50-day, bulls quickly wrested control of momentum. This week, the S&P 500 rallied 1.2 percent. The large cap index (4204.11) is not that far away from its all-time high of 4238.04 posted on the 7th this month and is currently facing resistance at 4210s.
Amidst this, May, up 0.6 percent, ended with a monthly dragonfly doji. This is a potentially bearish candle and needs confirmation. For the first time since bottoming in March last year, the index last week breached a trend line from that low and remains under despite this week’s rally. It is a rising trend line, so the breakout point rises with the passing of each day (chart here).
In the meantime, US-based equity funds in the week to Wednesday gained $8.2 billion (courtesy of Lipper). In the same week, SPY (SPDR S&P 500 ETF), VOO (Vanguard S&P 500 ETF) and IVV (iShares Core S&P 500 ETF) lost $281 million (courtesy of ETF.com); money-market funds – the so-called cash-on-the-sidelines – shot up $68 billion to $4.6 trillion; the all-time high of $4.8 trillion was posted a year ago (courtesy of ICI).
As things stand, even if the index manages to break out of 4210s and march toward 4238, it is unlikely it sustains.
Euro: Currently net long 104k, up 4.1k.
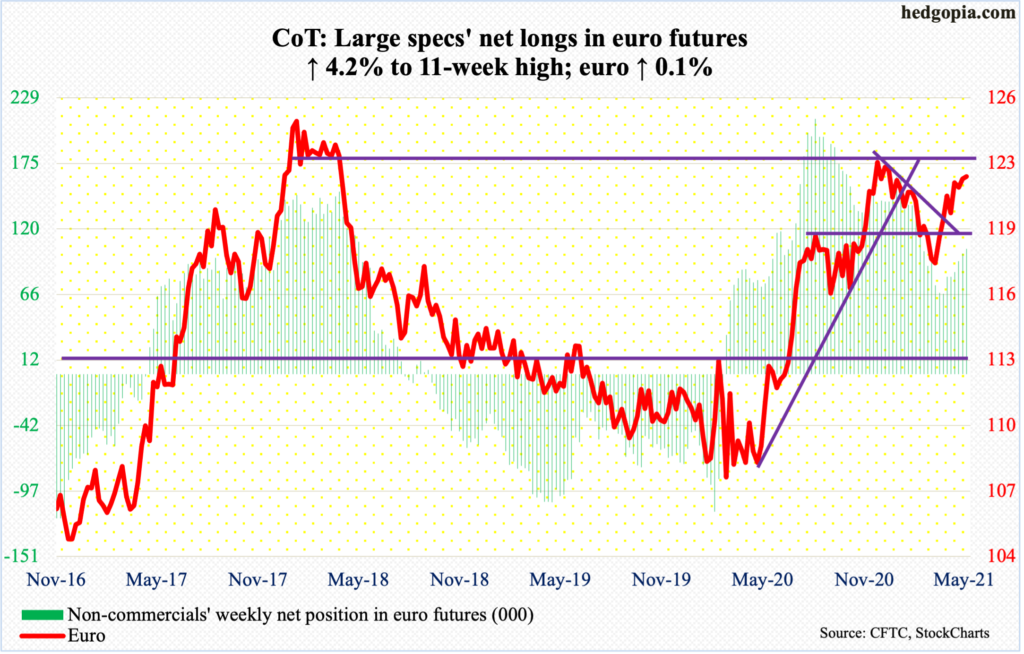
Euro bulls continued to build on the recent momentum, rallying the currency ($1.2193) as high as $1.2268 intraday Tuesday but were unable to hang on to the gains, with the session ending with a long-legged doji right at the daily upper Bollinger band. Tuesday’s high slightly surpassed the prior high of $1.2243 from February 25; back then, too, the euro reversed lower, eventually bottoming at $1.1712 on March 30.
The weekly produced a spinning top.
The daily seems to want to go lower. There is crucial horizontal support at $1.19-$1.20, which goes back 18 years. The 50- and 200-day are right there – respectively at $1.2016 and $1.1972.
Gold: Currently net long 214.6k, up 15.8k.
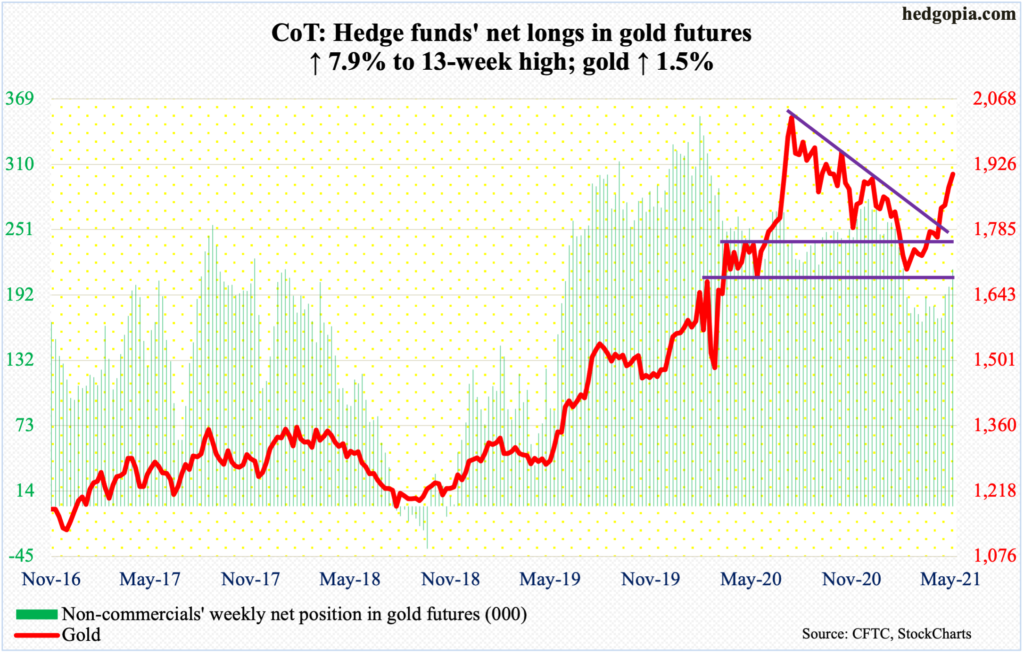
Non-commercials’ net longs have now reached a 13-week high.
Flows are cooperating. In the week to Wednesday, GLD (SPDR Gold ETF) took in $775 million. In the last three weeks, the ETF gained $1.5 billion. This comes on the heels of withdrawals of $8.7 billion in the prior 15 (courtesy of ETF.com).
Flows turned positive as gold ($1,905.30/ounce) early this month decisively broke free of $1,760s-$1,770s.
On March 8, gold bottomed at $1,673. This week, it went on to just about test $1,920s, which was reached back in September 2011 before coming under pressure to eventually bottom at $1,045 in December 2015. For 10 months now, bulls and bears have repeatedly fought for control of $1,920s, which was lost last November. In all probability, a breakout will occur in due course, but gold bugs are unlikely to recapture this level at the very first try.
On Wednesday, the metal ticked $1,916 intraday before reversing lower to end the session with a long-legged doji; this was followed by a doji on Thursday and a hanging man on Friday. Odds favor weakness in the sessions ahead. Immediately ahead, there is support at $1,870s, followed by $1,850s. The 200-day lies at $1,848.
Nasdaq 100 index (mini): Currently net short 13.3k, up 7.2k.
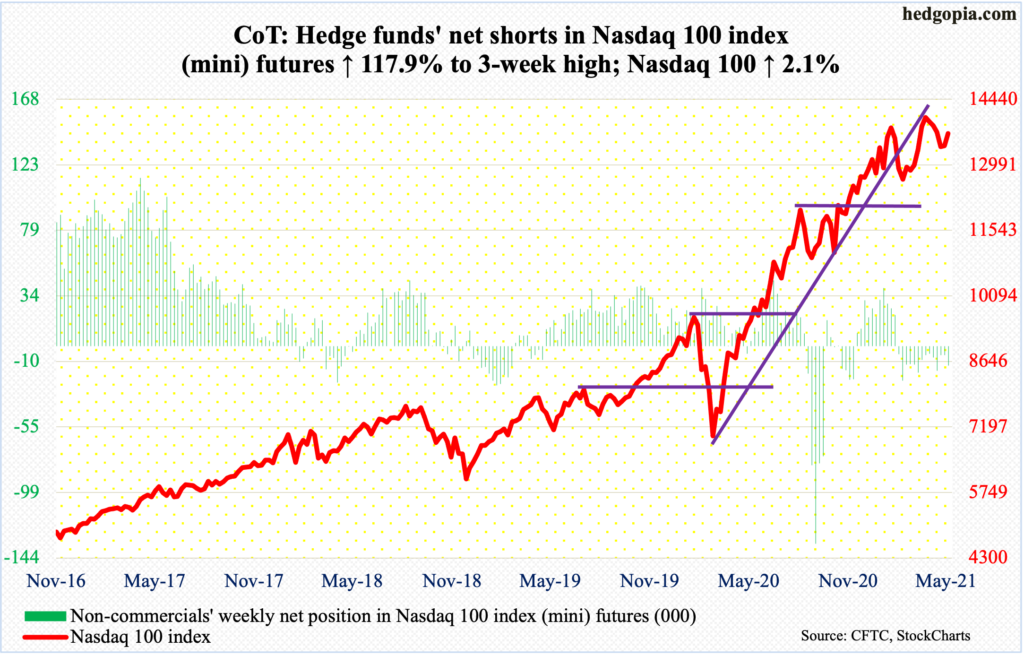
Yet another month and yet another potentially bearish monthly candle. May’s hanging man follows January’s long-legged doji, February’s dragonfly doji and March’s gravestone doji; April’s 5.9-percent rally in which a new all-time high of 14073 was posted tried to neutralize these candles, but May, down 1.3 percent, once again showed that sellers are getting active.
This week, the Nasdaq 100 (13686.51) rallied 2.1 percent, but at the same time repeatedly hit a roadblock at 13720s. The daily is getting extended.
Russell 2000 mini-index: Currently net short 33.9k, down 2.9k.
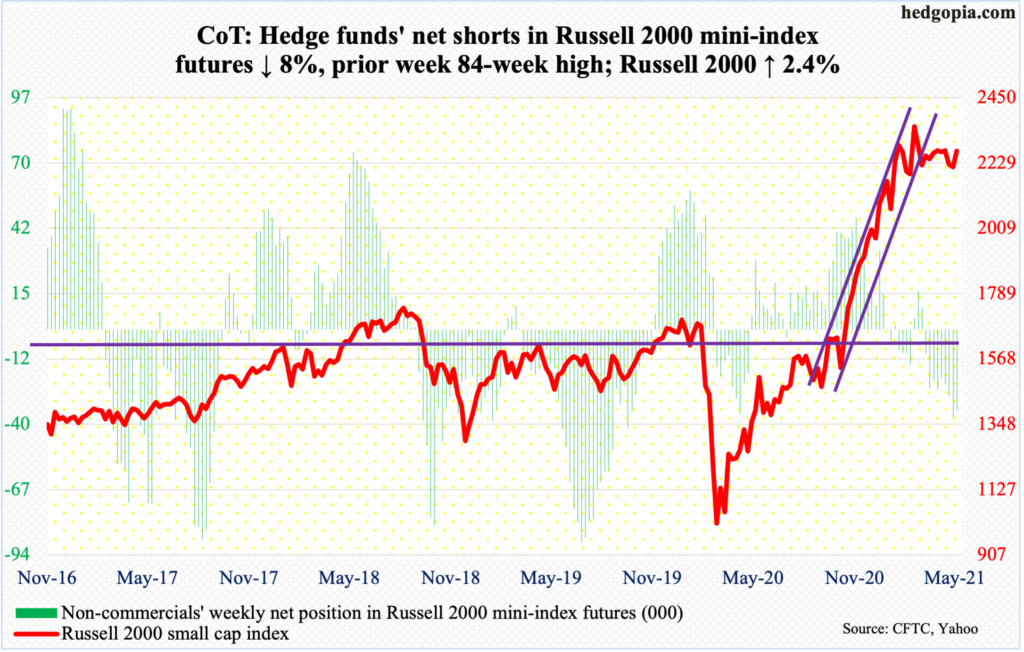
Small-cap bulls are doing their best – and succeeding – to disallow completion of a potential head-and-shoulders formation. The Russell 2000 (2268.97) is currently going sideways around the right shoulder, with the neckline at 2070s-2080s.
This week, bids showed up at 2206 on Tuesday. By Thursday, the small cap index was knocking against straight-line resistance at 2280s. The all-time high of 2360 was set on March 15. It is a long way off from here, but a rally past 2280s will be a positive development.
Ahead of this, $535 million came out of IWM (iShares Russell 2000 ETF) in the week to Wednesday (courtesy of ETF.com). For the last five weeks, the ETF has alternated between gains and losses. Bulls and bears are tussling for momentum. A failure at 2280s opens the door toward the neckline.
US Dollar Index: Currently net long 2.8k, up 96.
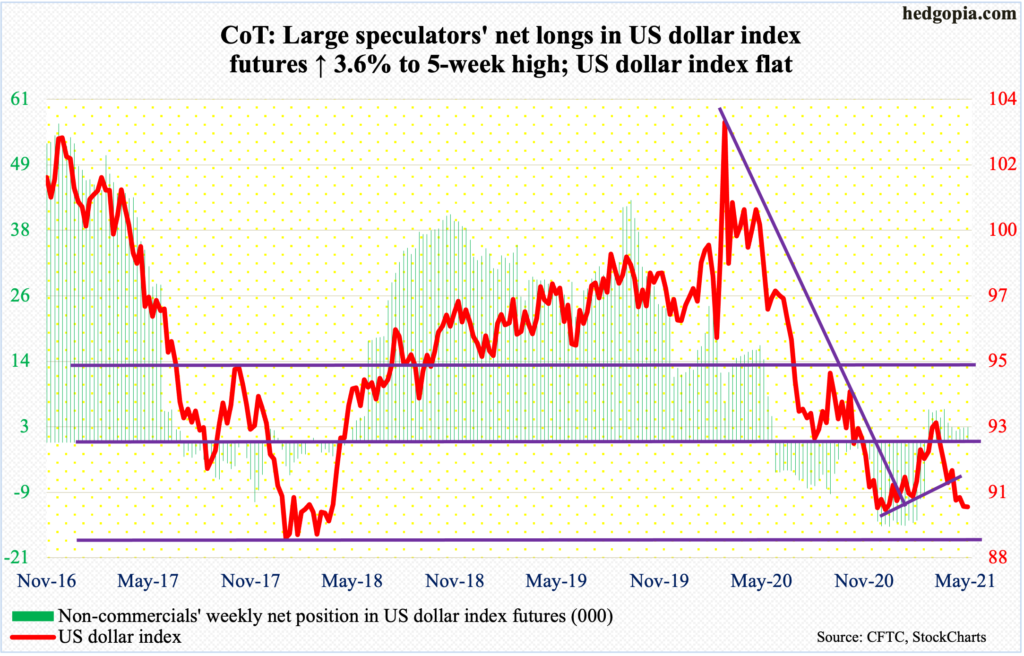
So far so good. Dollar bulls spent another week in defending crucial support at 88-89, which goes back at least 17 years. Tuesday’s low of 89.52 undercut last week’s low of 89.63 but not quite the low of 89.17 from January 6.
For the week, the US dollar index (89.99) was essentially unchanged, forming a long-legged doji.
On the daily, the MACD just completed a potentially bullish crossover. The weekly is getting oversold. The path of least resistance is up. Shorter-term averages are still pointing down, and they need to stabilize before a rally ensues.
VIX: Currently net short 60.9k, down 1.3k.
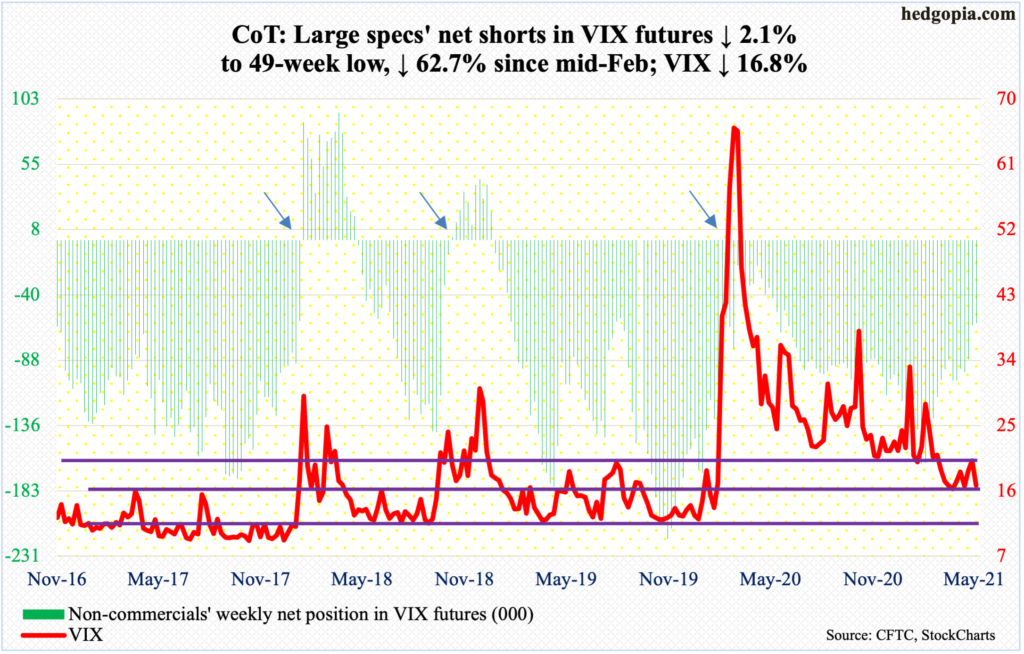
After a spike high of 28.93 on the 13th this month, VIX (16.76) quickly came undone.
The 50-day was breached on Monday; rally attempts in the following two sessions were resisted at the average. On Friday, the volatility index dropped as low as 15.90 but only to reverse higher with a hammer to end flat.
A rising trend line from April 14 has been breached but the intraday low of 15.38 from that date is intact. As is longer-term trend-line support (more on this here).
The daily is beginning to get oversold.


Comments
Log in or sign up to join the conversation.