The Best Undervalued Stocks To Buy Now
Image Source: Unsplash
Undervalued stocks refer to publicly listed companies that trade at a discount on their fair intrinsic value. Many investors use the price-to-earnings (P/E) ratio to find undervalued stocks. Investors must understand why a stock traded below its value, but many undervalued stocks have well-established track records.
Why are Stocks Undervalued?
Several reasons can contribute to an undervalued stock. Sometimes, the overall market sentiment drags companies lower, or a sector-related issue can make a stock undervalued. Companies may report disappointing earnings and a weak outlook, triggering a sell-off.
Why Should You Consider Investing in Undervalued Stocks?
Investing in undervalued stocks is like buying something on sale. For example, if an item that retails at $50 is available at $30, it would make sense to buy more and take advantage of the discount. Therefore, investing in undervalued stocks can deliver outsized returns, but investors must understand the reason behind the discount.
Here are a few things to consider when evaluating undervalued stocks:
- Look for undervalued stocks that have an established track record of profitability.
- Avoid undervalued companies with high debt levels.
- Invest in undervalued stocks that pay sustainable dividends.
- Understand the reason behind the discounted share price.
- Be careful with undervalued stocks that undergo structural changes.
What are the Downsides of Undervalued Stocks?
Undervalued stocks can become more undervalued, especially if negative market sentiment persists. While most investors use P/E ratios, discounted cash flow analysis, or dividend discount models, the conclusions are subjective. Since it depends on individual analysis, it could be flawed and result in an incorrect valuation. Another area of concern is that it may take years for an undervalued stock to close the gap to its fair intrinsic value.
Here is a shortlist of currently attractive undervalued stocks:
- Comcast (CMCSA)
- Eastman Chemical Company (EMN)
- Banco Santander (SAN)
- Chipotle Mexican Grill (CMG)
- The Campbell’s Company (CPB)
- Arch Capital Group (ACGL)
- UiPath (PATH)
- Constellation Brands (STZ)
- Bristol-Myers Squibb Company (BMY)
- The Clorox Company (CLX)
Banco Santander Fundamental Analysis
Banco Santander (SAN) is a multinational financial services company, the 14th-largest banking institution globally, and the Financial Stability Board considers it a systemically important bank. SAN is also a component of the Euro STOXX 50.
So, why am I bullish on SAN after its earnings beat?
Banco Santander reported record profits for the first nine months of 2025, with a record quarterly profit of €3.5 billion. Quarterly fees rose 8%, while expenses decreased 1%. Its Capital Ratio (CET1) rose to an all-time high of 13.1%. It also revealed at least €10 billion worth of share buybacks through 2026. I remain bullish on SAN’s disciplined capital allocation and improved profitability, while its rising presence in Asia and Latin America should provide an additional growth catalyst.
|
Metric |
Value |
Verdict |
|
P/E Ratio |
10.36 |
Bullish |
|
P/B Ratio |
1.28 |
Bullish |
|
PEG Ratio |
2.67 |
Bearish |
|
Current Ratio |
Unavailable |
Bearish |
|
Return on Assets |
0.74% |
Bearish |
|
Return on Equity |
13.46% |
Bullish |
|
Profit Margin |
19.79% |
Bearish |
|
ROIC-WACC Ratio |
Unavailable |
Bearish |
|
Dividend Yield |
2.03% |
Bearish |
Banco Santander Fundamental Analysis Snapshot
The price-to-earnings (P/E) ratio of 10.36 makes SAN an inexpensive stock. By comparison, the P/E ratio for the S&P 500 Index overall is 30.80.
The average analyst price target for SAN is 9.63. While it suggests no upside potential from current levels, I see more upside thanks to its rising presence in Asia, while downside risks remain acceptable.
Banco Santander Technical Analysis
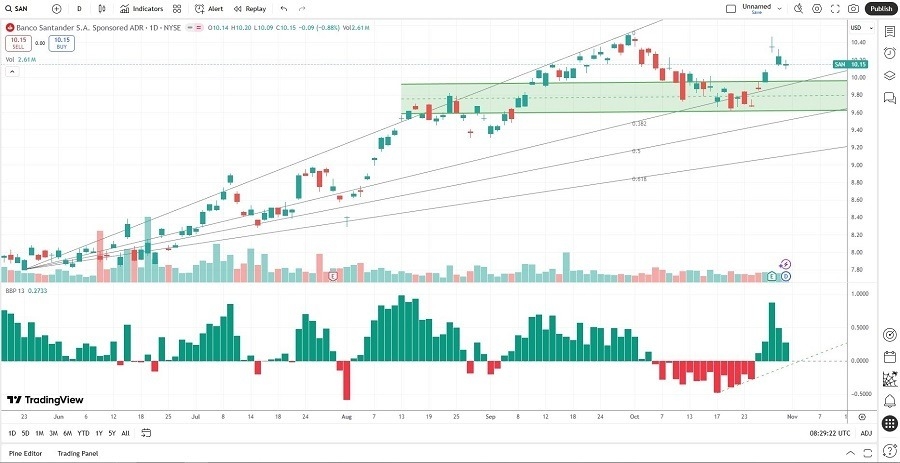
(Click on image to enlarge)

Banco Santander Price Chart
- The SAN D1 chart shows price action between its ascending 0.0% and 38.2% Fibonacci Retracement Fan levels.
- It also shows Banco Santander breaking out above a bullish price channel.
- The Bull Bear Power Indicator is bullish with an ascending trendline.
My Call on Banco Santander
I am taking a long position in SAN between $9.96 and $10.20. This undervalued stock ranks among my favorite banking stocks. I am bullish on digital transformation, excellent capital position, cost efficiencies, and growth prospects in Asia and Latin America.
Chipotle Mexican Grill Fundamental Analysis
Chipotle Mexican Grill (CMG) is a fast-casual restaurant chain known for preparing orders in front of customers. It has been the best-performing restaurant stock since its IPO. CMG has over 3,800 locations. Chipotle Mexican Grill is also a member of the S&P 500.
So, why am I bullish on Chipotle Mexican Grill despite its post-earnings plunge?
While its downgraded outlook forecasts a low single-digit decline in comparable restaurant sales for 2025, the 15%+ plunge was a severe overreaction. Earnings per share came in at $0.29, as expected. Same-store sales rose 0.3%, as a 1.1% rise in average spending per consumer offset a 0.8% drop in traffic. I remain bullish on its expansion plans to reach 7,000 locations, its catering service, and its digital push, which has seen its loyalty program grow to over 40 million customers in five years.
|
Metric |
Value |
Verdict |
|
P/E Ratio |
28.04 |
Bullish |
|
P/B Ratio |
15.30 |
Bearish |
|
PEG Ratio |
1.73 |
Bullish |
|
Current Ratio |
1.54 |
Bearish |
|
Return on Assets |
16.55% |
Bullish |
|
Return on Equity |
47.69% |
Bullish |
|
Profit Margin |
13.04% |
Bullish |
|
ROIC-WACC Ratio |
Positive |
Bullish |
|
Dividend Yield |
0.00% |
Bearish |
Chipotle Mexican Grill Fundamental Analysis Snapshot
The price-to-earning (P/E) ratio of 28.04 makes CMG an inexpensive stock. By comparison, the P/E ratio for the S&P 500 Index is 30.80.
The average analyst price target for Chipotle Mexican Grill is $45.09. It suggests excellent upside potential with decreasing downside risk.
Chipotle Mexican Grill Technical Analysis
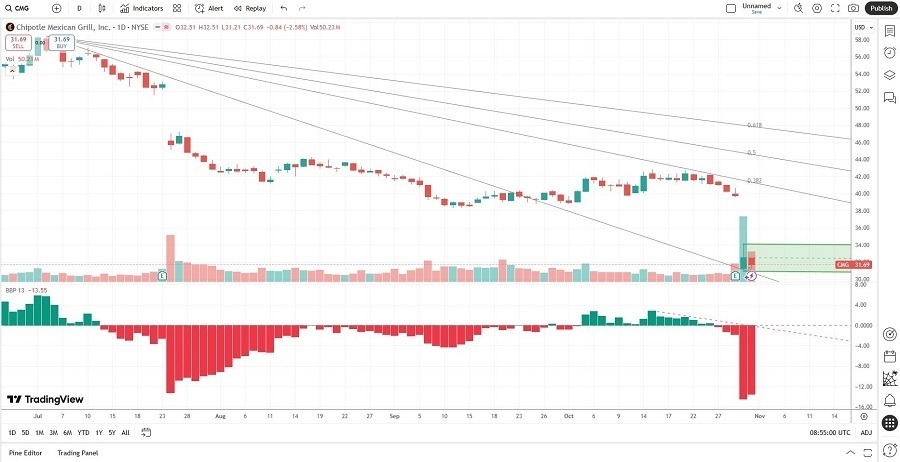
(Click on image to enlarge)

Chipotle Mexican Grill Price Chart
- The CMG D1 chart shows price action between its descending 0.0% and 38.2% Fibonacci Retracement Fan following a double breakout.
- It also shows Chipotle Mexican Grill forming a new horizontal support zone, with rising bullish trading volumes.
- The Bull Bear Power Indicator turned bearish with a descending trendline but suggests bearish exhaustion.
My Call on Chipotle Mexican Grill
I am taking a long position in Chipotle Mexican Grill between $31.01 and $34.13. I expect foot traffic to recover faster than expected. Still, near-term economic headwinds remain, as CMG noted, young people without jobs cannot afford to eat at Chipotle Mexican Grill. Valuations are acceptable, and I see plenty of upside potential.
More By This Author:
Constellation Energy Stock Signal: Should You Sell Before Earnings?
BTC/USD Forex Signal: Looking Bullish On Trade Deal Prospect
The Best Dividend Stocks To Buy Now
Risk Disclaimer: DailyForex will not be held liable for any loss or damage resulting from reliance on the information contained within this website including market news, analysis, trading signals ...
more


