Constellation Energy Stock Signal: Should You Sell Before Earnings?
Short Trade Idea
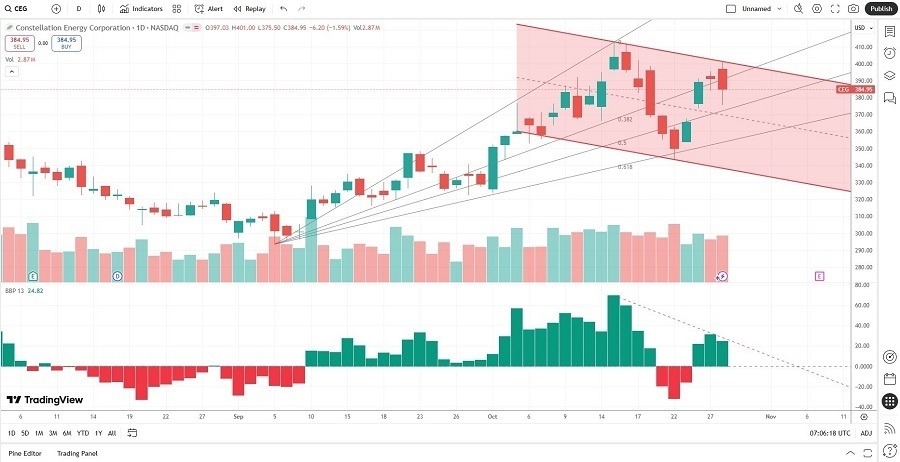
Enter your short position between $375.50 (yesterday’s intra-day low) and $401.00 (yesterday’s intra-day high).
Market Index Analysis
- Constellation Energy (CEG) is a member of the Nasdaq 100 and the S&P 500 indices.
- Both indices recorded fresh record highs amid rising bearish indicators.
- The Bull Bear Power Indicator for the S&P 500 is in extreme bullish territory at unsustainable levels, suggesting upside exhaustion is forming.
Market Sentiment Analysis
Equity markets extended their record run, once again fueled by AI-related stocks, with Nvidia leading the way. Investors ignore concentration risks, as the rest of the market is not doing as well. The divergence between the AI-led indices and the Russell 2000, which declined, is another red flag. While most agree that an AI bubble exists, opinions on whether and when it will burst differ. Optimism about earnings seasons, today’s anticipated interest rate cut, and a significant trade deal between the US and China have overshadowed bearish catalysts, such as a decline in consumer confidence, a weak labor market, and rising debt.
Constellation Energy Fundamental Analysis
Constellation Energy is the largest nuclear power generator and a leading energy company in the US. It is also at the forefront of powering data centers for AI companies and is a leading player in the green energy revolution.
So, why am I bearish on CEG ahead of next week’s earnings release?
I expect Constellation Energy to report revenues below the comparable period last year. I am bearish due to high capital expenditures and expect earnings per share to decline further. Another concern I have is that liabilities rise faster than assets, and the meager dividend fails to compensate investors for the added risk. I will also monitor operating margins, which rank among the worst in the industry.

Constellation Energy Fundamental Analysis Snapshot
The price-to-earning (P/E) ratio of 40.14 makes CEG an expensive stock. By comparison, the P/E ratio for the S&P 500 Index is 30.52.
The average analyst price target for CEG is $396.21, suggesting negligible upside potential with increased downside risks.
Constellation Energy Technical Analysis
Today’s CEG Signal
(Click on image to enlarge)

Constellation Energy Price Chart
- The CEG D1 chart shows price action inside a bearish price channel.
- It also shows price action between its ascending 38.2% and 50.0% Fibonacci Retracement Fan levels, following a breakdown.
- The Bull Bear Power Indicator is bullish with a descending trendline, drifting towards a bearish crossover.
- The average bearish trading volumes are higher than the average bullish trading volumes.
- CEG struggled to hold on to gains as the S&P 500 hit new all-time highs, a bearish confirmation.
My Call on Constellation Energy
I am taking a short position in CEG between $375.50 and $401.00. CEG is one of the most expensive stocks in its industry. Despite its association with AI to power data centers, revenue growth is slowing, earnings per share are decreasing, and CEG struggles with negative operating cash flow.
- CEG Entry Level: Between $375.50 and $401.00
- CEG Take Profit: Between $293.15 and $316.18
- CEG Stop Loss: Between $412.70 and $425.08
- Risk/Reward Ratio: 2.21
More By This Author:
BTC/USD Forex Signal: Looking Bullish On Trade Deal ProspectThe Best Dividend Stocks To Buy Now
Weekly Forex Forecast - Sunday, Oct. 26
Risk Disclaimer: DailyForex will not be held liable for any loss or damage resulting from reliance on the information contained within this website including market news, analysis, trading signals ...
more


