Term Spread Recession Forecasts For January 2024
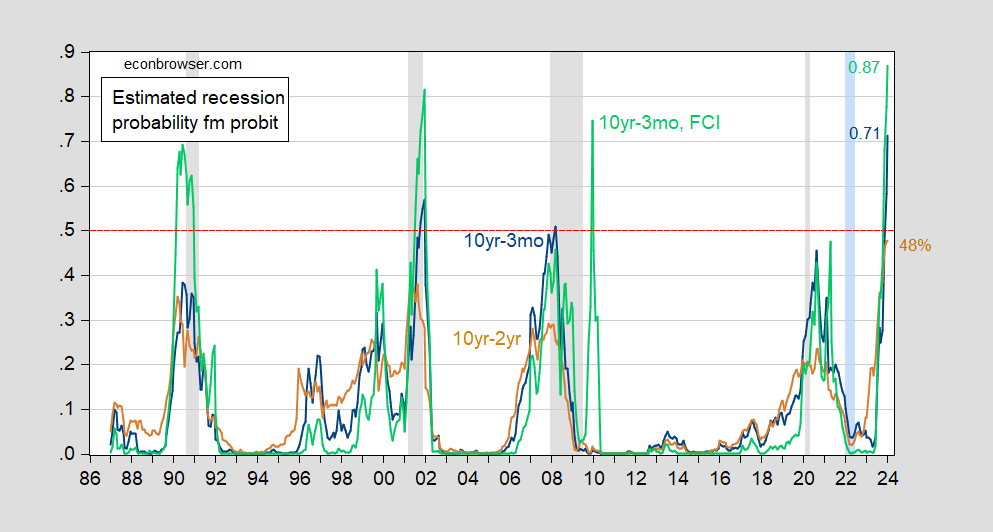
Plain vanilla probit models indicate a high probability of recession, especially using the 10yr-3mo spread:
(Click on image to enlarge)

Figure 1: Forecasted probability of recession from 10yr-3mo term spread (blue), from 10yr-2yr term spread (tan), 10yr-3mo term spread augmented by FCI(green). All models estimated over 1986M01-2023M01. NBER defined peak-to-trough recession dates shaded gray. Red dashed line at 50% probability. Source: author’s calculations, NBER.
The 10yr-3mo spread implied recession probability breaches the 50% threshold; while the 10yr-2yr does not, it comes very close. Adding in a financial conditions index pushes the probability to 87%, but this specification also yields a false positive in 2009-10.
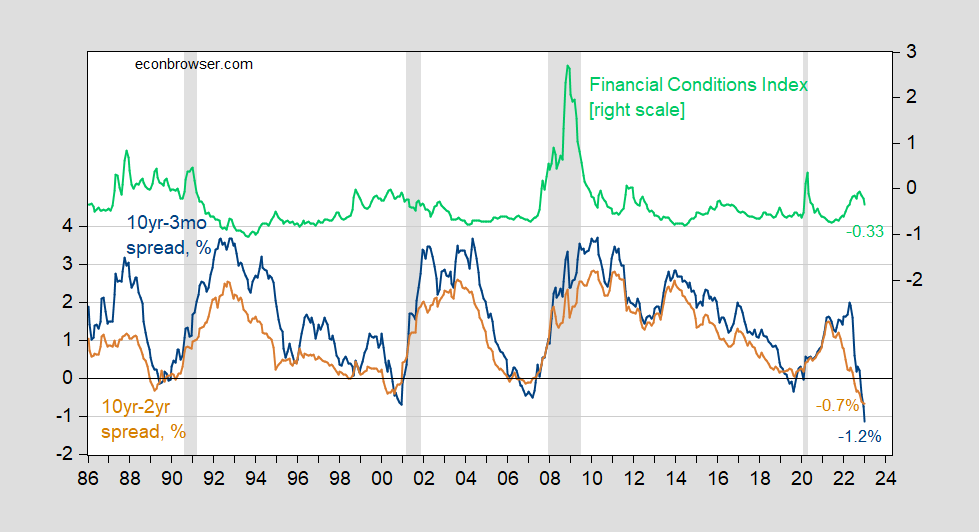
These are the spreads as of today (January data runs through January 30th).
(Click on image to enlarge)

Figure 2: US Treasury 10yr-3mo term spread (blue, left scale), 10yr-2yr (tan, left scale), both in %, and Chicago Fed National Financial Conditions Index (green, right scale). January 2023 spreads thru 1/30; FCI thru 1/20. NBER defined peak-to-trough recession dates shaded gray. Source: Treasury, Chicago Fed via FRED, NBER, and author’s calculations.
Interestingly, one of the main early proponents of the term spread as indicator, Campbell Harvey, has argued that this time is different:
Despite the curve being inverted for the ninth time since 1968, Harvey said it’s probably not a harbinger for a recession.
…
‘Dodge the Bullet’
Harvey’s model was linked to inflation-adjusted yields and he said the fact inflation expectations are inverted — meaning traders see price pressures easing through time — also eases odds for a recession ahead.“When you put all this together it suggests we could dodge the bullet,” Harvey said. “Avoiding the hard-landing — recession — and realizing slow growth or minor negative growth. If a recession arrives, it will be mild.”
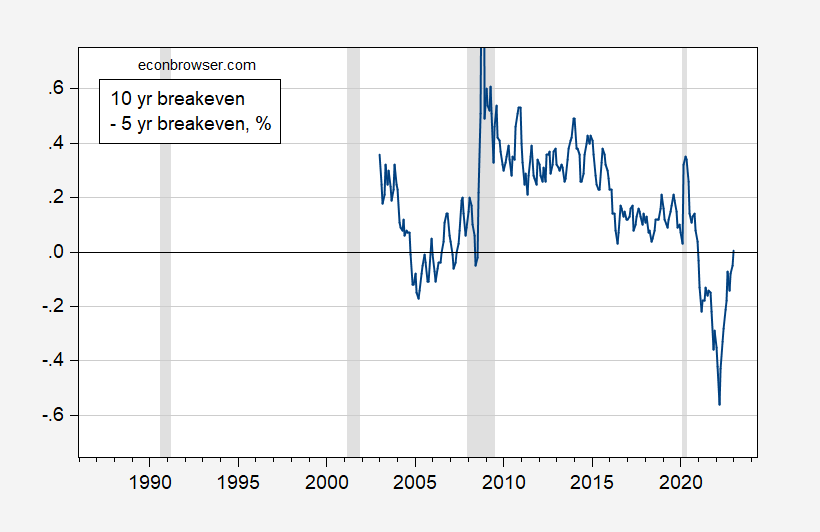
Indeed, the term structure of inflation expectations is (or was) also inverted, as opposed to what occurred before the 2007-09 and 2020 recessions.
(Click on image to enlarge)

Figure 3: 10 yr inflation breakeven minus 5 yr inflation breakeven, calculated using Treasury-TIPS spreads, % (blue). NBER defined peak-to-trough recession dates shaded gray. Source: Treasury via FRED, NBER and author’s calculations.
The estimated term structure of inflation expectations from the Philadelphia Fed indicates lower expected inflation at longer horizons, and this is more pronounced than it was a year ago, and even a month ago (see Philadelphia Fed estimates). He reiterated this point just a few hours ago [video].
So, we’ll see if this time is indeed different…
[I don’t have ready access to the foreign term spread for January, so I can’t estimate the Ahmed-Chinn specification.]
More By This Author:
Cyclically Adjusted Federal Budget Balance
Personal Consumption Expenditures And Inflation – Services Vs. Goods
GDP, GDP+, And GDO(?) For Q4
Disclosure: None.


