

Image Source: Unsplash
Take a look at the tell-tale signs from the market breadth, price, and volume to find out how likely S&P 500 is to break above the resistance zone.
Watch the video below to spot the difference in the characteristics of the price action between the current development and the past two analogs in March and May 2022.
Video Length: 00:10:41
The bullish setup vs. the bearish setup is 279 to 81 from the screenshot of my stock screener below.
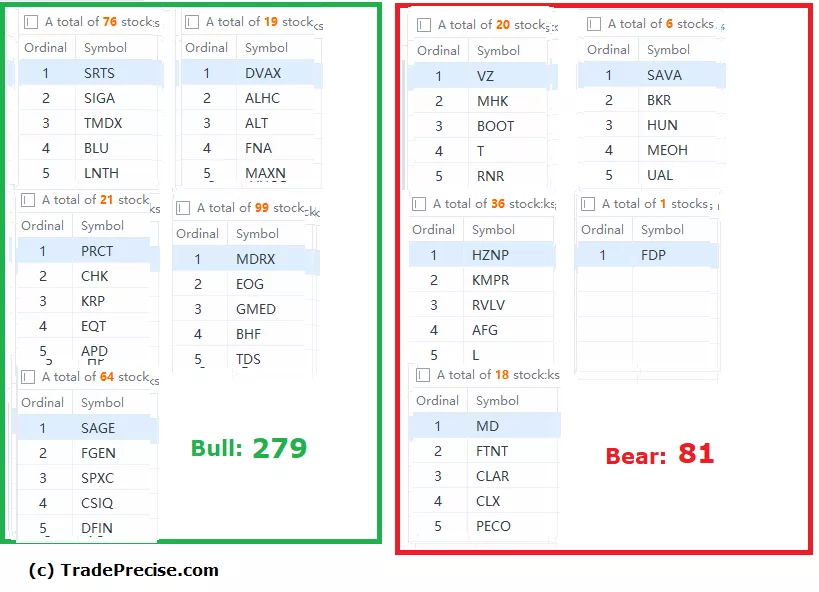
Despite the pullback in the indices last week on top of the increase of the volatility in many stocks reacting to the earning announcements, there are still more bullish setups than bearish setups.
Having said that, stock selection and the entry point are crucial in this volatile market environment as the market bottoming process might be unfolding according to this breadth thrust indicator.
More By This Author:
Here Is How To Identify The Market Bottom With This Breadth Thrust Indicator
Here Is How To Predict The Next Bull Run With The Wyckoff Trading Method
10 Top Market Leaders That Could Emerge As Multibaggers In The Next Bull Market


Comments
Log in or sign up to join the conversation.