
Here is how to use the breadth thrust indicator as a momentum starter to determine the stock market bottom based on the past 6 events in 2009, 2010, 2011, 2016, 2018 and 2020.
Watch the video below and pay attention to establishing the context between the market breadth and the S&P 500 from the momentum aspect.
Video Length: 00:11:21
The bullish setup vs. the bearish setup is 434 to 66 from the screenshot of my stock screener below.
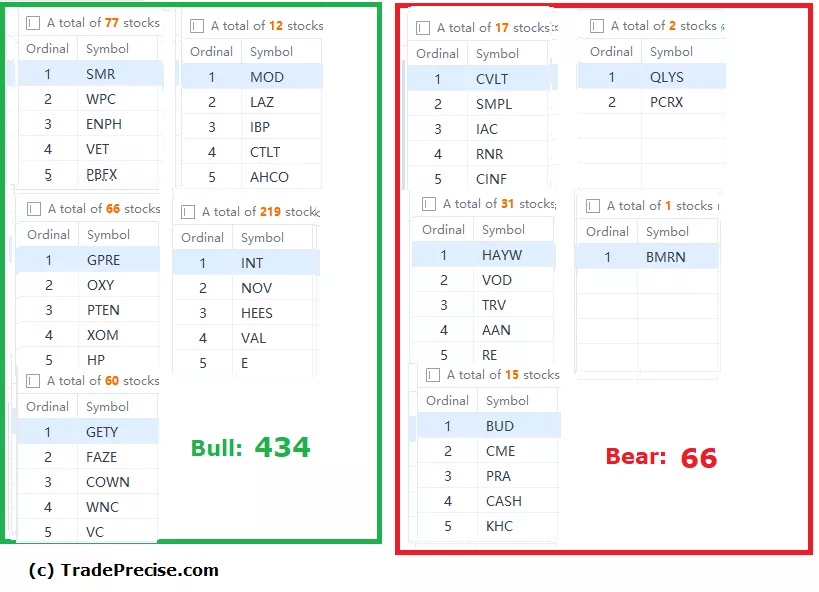
Although the bullish setups are gaining momentum, the market is short term overbought and testing the resistance zone. It is prudent to pick the best quality setup with decent reward to risk among the outperforming stocks.
More By This Author:
Here Is How To Predict The Next Bull Run With The Wyckoff Trading Method
10 Top Market Leaders That Could Emerge As Multibaggers In The Next Bull Market
Stock Market Bottom?


Comments
Log in or sign up to join the conversation.